
Bitcoin Price Key Highlights
- Bitcoin’s price is stuck in a consolidation pattern once more, as bulls are taking a break from their recent strong rally.
- This type of consolidation pattern has already been seen in the past, with Bitcoin’s price making an upside breakout from the bullish continuation signal.
The Bitcoin price has formed a bullish flag pattern on its 1-hour time frame, which suggests that more buyers could join the game once an upside breakout occurs.
How High Can It Go?
The mast of the bullish flag continuation pattern is approximately $30 in height, spanning from $395 to $425, so a resulting upside move from the latest one could extend by the same amount. This could take Bitcoin prices up to $450-460 in the near-term.
Stronger bullish momentum could even take price up to the $500 highs this year, with plenty of traders keen to take profits off that level. If you’re bearish on bitcoins, you could wait for an actual test of the psychological resistance level to short the cryptocurrency.
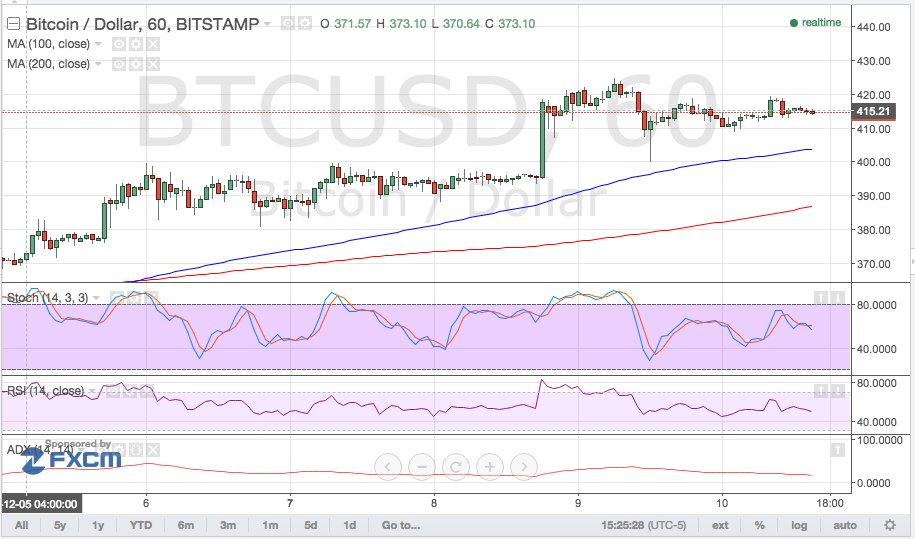

The 100 SMA is above the 200 SMA and has increased its distance, indicating that bullish pressure is building up. The consolidation has gotten tighter in the past few hours, hinting that a breakout is bound to take place.
The stochastic oscillator is pointing down, though, which means that buyers are already exhausted and might need to let sellers take over. RSI is also on the move down, indicating that bearish momentum is present. In that case, a downside break could lead to a pullback to the moving averages or the area of interest at $380-395.
The average directional index is heading south and understandably so, as ranging market conditions are currently in play. Potential market catalysts include the release of US retail sales and PPI numbers on Friday, as this might impact USD price action.
Intraday support level – $395
Intraday resistance level – $425
Charts from Bitstamp, courtesy of TradingView