Bitcoin price rose to print a high of around $298 yesterday, before declining to around $288, which touches the rising support level we spotted on Wednesday’s analysis, earlier today. It seems like we are witnessing a “whiplash” downwards phase that proceeds a forwards phase that will lead to a breakthrough the $300 resistance level.
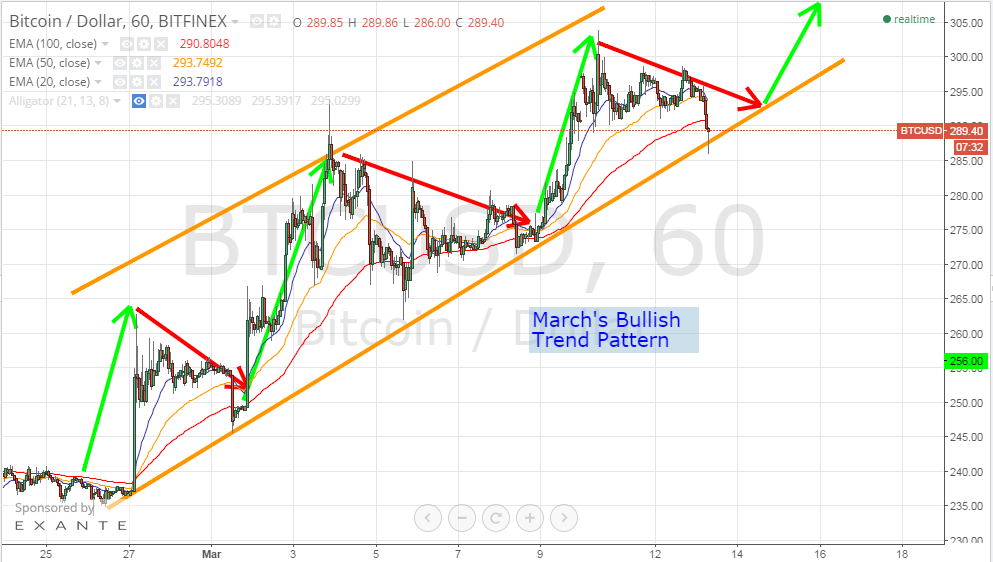
By studying the 1 hour Bitfinex (BTC/USD) chart from tradingview.com and plotting the 20, 50 and 100 period EMAs accordingly (look at the below chart), we can conclude the following:
- Since the beginning of March’s bullish trend, bitcoin price has been increasing along the orange trend lines on the below chart; it rises then drops to touch the rising support level before rising again.
- At the time of writing of this analysis, bitcoin price declined to touch the new support level, which is expected to reverse the downwards price correction movement as occurred on 3 occasions since the beginning of the new bullish wave. The upcoming upwards wave will probably push the price to test the $300 resistance level within the next 12 to 24 hours.
- Bitcoin price falls below the 20, 50 and 100 hour EMAs right before the downwards price correction wave starts. This was evident on 3 occasions since the beginning of March.
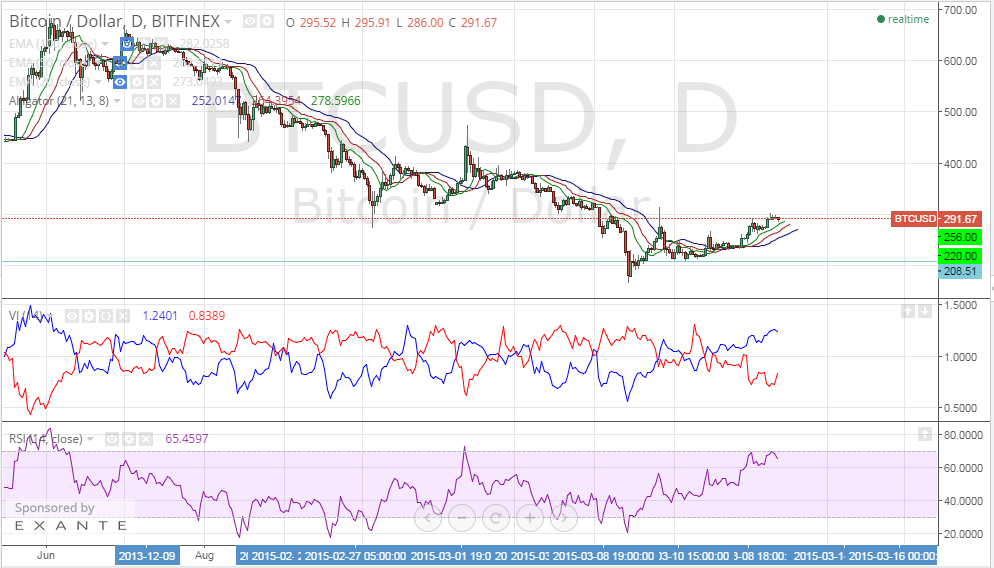
By studying the 1 day Bitfinex (BTC/USD) chart from tradingview.com and plotting the William’s Alligator indicator, RSI and Vortex Indicator (VI) accordingly (look at the below chart), we can notice the following:
- The SMAs of the William’s Alligator indicator show a perfect bullish alignment, so we expect the bullish wave to continue on pushing bitcoin price to higher levels.
- The VI is signaling continuation of the bullish wave as the blue uptrend line is above the red downtrend line and the gap between both is increasing.
- The RSI is around 64 at the moment. A rise above 70 can be a warning signal that flags stoppage of the bullish wave.
Conclusion:
Bitcoin price dropped to around $288 earlier today as the market was attempting to correct it. Our technical analysis predicts a rise in bitcoin price so that we can see the $300 resistance level retested within the next 24 hours or so.
Charts from bitfinex