Bitcoin Price Key Highlights
- Bitcoin’s price appears to be having trouble sustaining its climb, as it is testing the ceiling at the latest highs.
- If this area continues to hold as resistance, the Bitcoin price could complete a double top pattern with a neckline at $400.
Bitcoin’s price is undergoing weaker bullish momentum, with a return in selling pressure likely to spur a continued selloff.
Potential Downtrend
A break below the possible double top neckline could set off a longer-term downtrend for the Bitcoin price, likely taking it down to the next area of interest around $300-350.
For now, the 100 Simple Moving Average appears to be holding as support. This short-term moving average is also above the longer-term moving average, indicating that the path of least resistance is to the upside.
However, Bitcoin’s price might need to gather enough momentum to break past the latest highs around $465 before confirming that the uptrend is set to carry on. The stochastic oscillator and Relative Strength Index are both on the move down, which suggests that sellers are still in control at the moment.
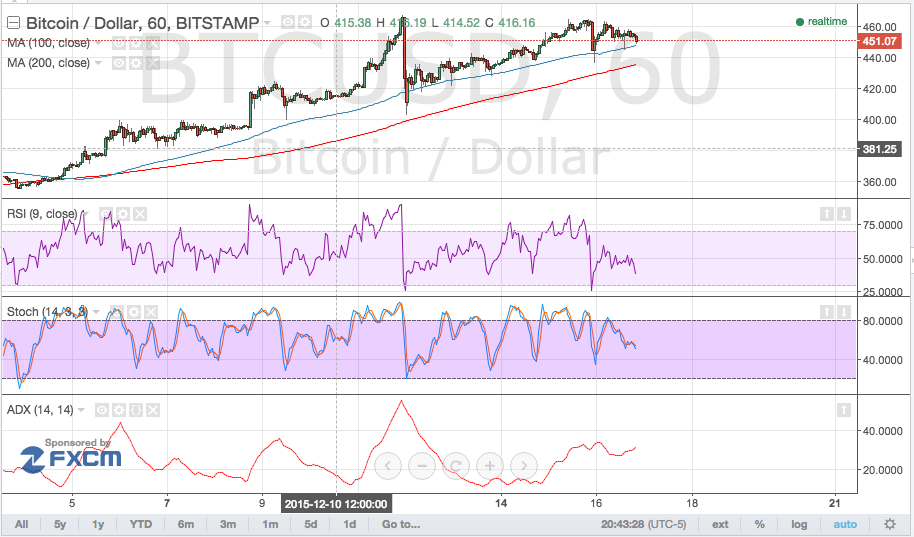

Once the oscillators reach the oversold region, more buyers could get back in the game and trigger a bounce. A larger pullback to the 200 SMA at $430 might still be possible before bullish momentum returns.
The average directional index is still below the 50 level so ranging market conditions are in play. A move past 50 could show a return to a trending market environment but until then, Bitcoin’s price could consolidate between $430-465.
The FOMC statement failed to provide a strong catalyst for a breakout in either direction, as market watchers were unsure how to react to the surprisingly upbeat statement. While the rate hike to 0.50% was largely expected, the hawkish outlook from policymakers and Fed head Yellen herself was a bit of a surprise.
Looking at the Indicators
Intraday support level – $430
Intraday resistance level – $465
- 100 SMA and 200 SMA
- Stochastic (14, 3, 3)
- RSI (14)
- ADX (14)
Charts from Bitstamp, courtesy of TradingView