

Bitcoin Price Key Highlights
- As predicted in an earlier article, bitcoin price was hit by profit-taking during the FOMC statement, as the US central bank decided to hike interest rates for the first time in nearly a decade.
- Price is now testing the rising trend line visible on the 1-hour and 4-hour time frames and may be due for a bounce.
Reversal Pattern?
The 100 SMA is still above the longer-term 200 SMA, which means that the path of least resistance is to the upside. However, a downward crossover is looming so a reversal could also be possible if that happens.
In addition, a complex double top pattern may be forming since price failed in its last couple of attempts to break past the $460 resistance. The neckline of the chart pattern is located at $400 and a break below this level could set off a longer-term reversal.
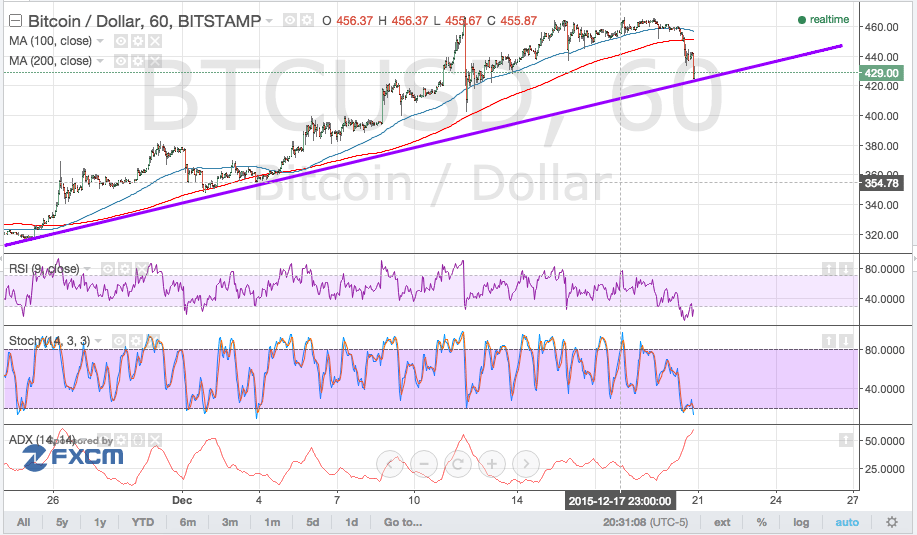

RSI is already indicating oversold conditions so buyers may take control of price action soon. Stochastic is also in the oversold area but hasn’t turned higher yet. Once it does, bullish pressure could lift bitcoin price again.
Meanwhile, the average directional index is above the 50.0 level once more, indicating that trending conditions are in play. And since bitcoin price is coming from an uptrend, there’s a higher likelihood that the ongoing trend could carry on.
However, the US dollar is currently enjoying strong demand following the Fed interest rate hike and may continue to do so until the next few days of the year and early on next year. FOMC policymakers have expressed their confidence that the US economy can continue its recovery, upgrading growth and employment estimates for next year.
A break below the neckline at $400 could take bitcoin price down to $340, as the double top pattern is approximately $60 in height. On the other hand, a bounce off the trend line could take bitcoin price back up to $460 or higher.
Charts from Bitstamp, courtesy of TradingView