Bitcoin price resumed increasing today, reaching a high of $247 as the market’s trading volume is higher than yesterday’s. As the bullish wave is building up, we can soon see the price heading up to $300 as soon as the $256 resistance level is broken.
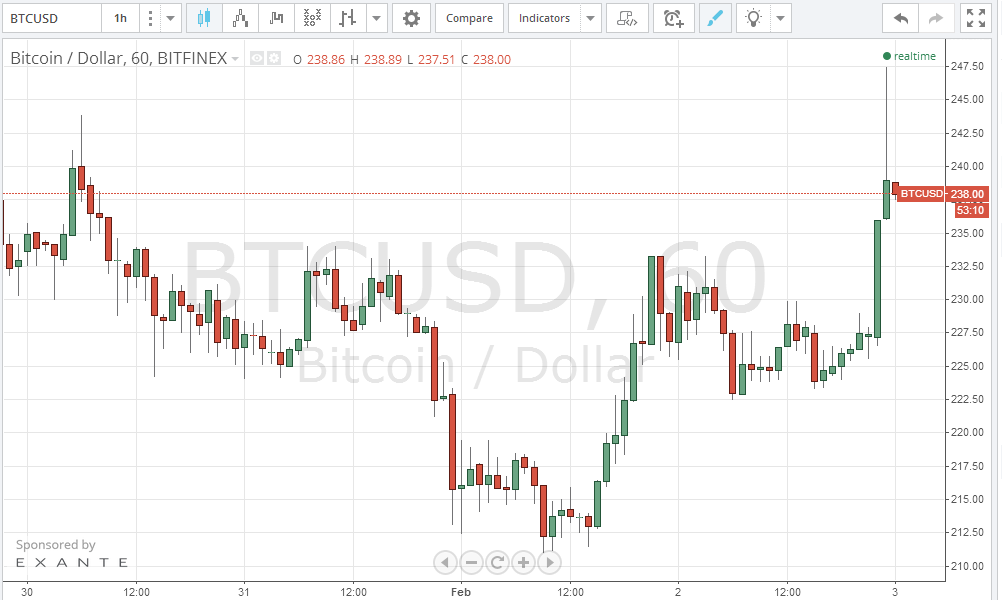
By examining the 1 hour Bitfinex (BTC/USD) charts from tradingview.com (look at the below chart), we can see that today’s trading has led to the formation of 7 successive green bullish candles, which is a sign denoting that the bullish wave has the strength to continue. We can notice that today’s bullish rally occurred at approximately the same time of yesterday’s bullish rally between 16:00 and 21:00 GMT which somehow coincides with market close in the Western world. Accordingly, it seems that we are going to see this pattern repeatedly during the following days; a few-hour bullish wave followed by a longer period of slow downward price correction.
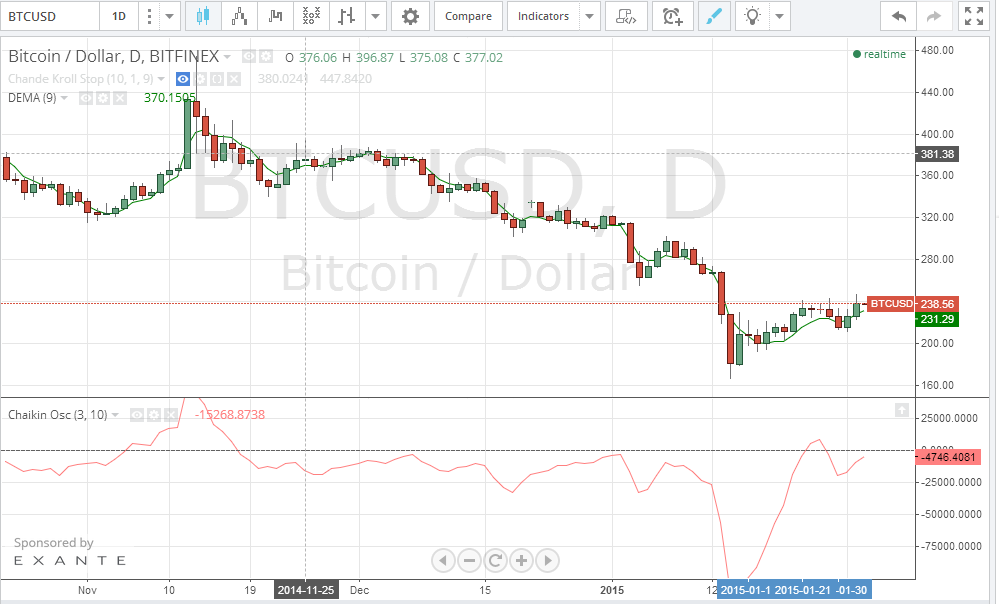
According to our previous analyses, it is clear how we can see the bitcoin price advancing to $300 as soon as the $256 resistance level is broken. We will use the Chaikin Oscillator to anticipate a growing bullish momentum by measuring the difference between the Accumulation Distribution Line of the 3 day EMA and the Accumulation Distribution Line of the 10 day EMA. By calculating the (3, 10) Chaikin Oscillator for the 1 day Bitfinex (BTC/USD) charts (look at the below chart), we can notice that the oscillator’s value is in the negative territory; However, the oscillator’s curve is sloping upwards and is likely to cross over to the positive territory soon. A positive Chaikin Oscillator denotes a prevailing buying market power for the bitcoin price market.
Conclusion:
Bitcoin price started a new bullish wave. A further continuation of the current buying power of the market can push the price up to $300 soon.
Charts: Bitfinex.