
Bitcoin Price Key Highlights
- Bitcoin price appears to be moving sideways these days, barely able to establish a clear strong direction after its sudden rally and subsequent drop earlier in the month.
- Price is bouncing back and forth between support at $315 and resistance at $340, and might stay inside this range for quite some time.
Technical indicators are suggesting that bitcoin price could keep moving inside its short-term range, although the path of least resistance is still to the downside.
Mid-Range Area of Interest
At the moment, bitcoin price is stalling at the middle of its range around $330, still deciding whether to carry on with its climb to the top or to retest support. The moving averages are right in the middle of the range also, holding as dynamic resistance levels.
In addition, the 100 SMA and 200 SMA are oscillating, a classic signal of ranging market conditions. A break above the $325 area could put bitcoin price on track towards the range resistance while reversal candlesticks around the current levels could spur a move down.
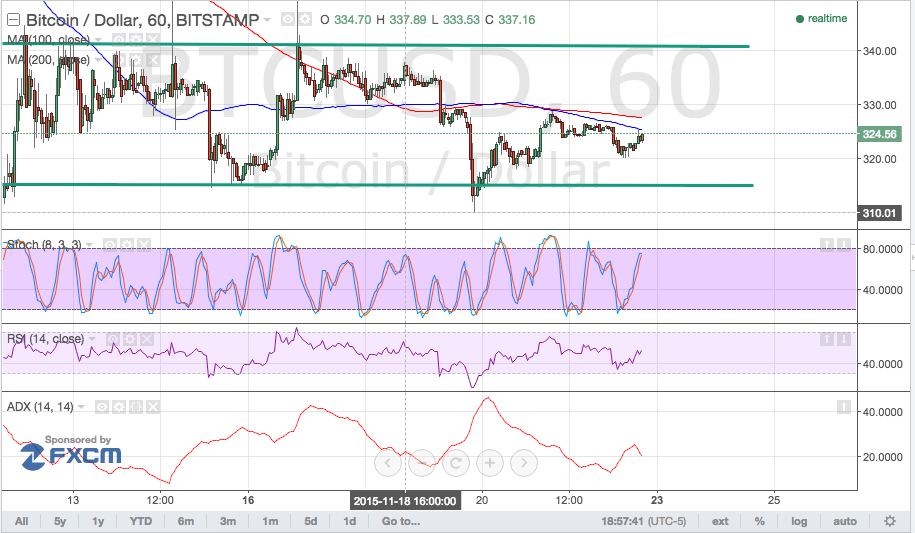

Stochastic is on the move up, suggesting that buyers are still in control of bitcoin price action and that further gains are possible. Similarly, RSI is heading north, which means that price could follow suit.
The average directional index has picked up a bit, rendering a possible return in trending market conditions. However, the indicator appears to have pointed down once more to signal consolidation.
Nonetheless, a breakout in either direction could spark one last directional play for bitcoin price before the end of the year. The path of least resistance is to the downside owing the upcoming Fed rate decision, during which the US central bank is widely expected to raise interest rates and spur US dollar demand.
Intraday support level – $315
Intraday resistance level – $340
Technical Indicators Settings:
100 SMA and 200 SMA
Stochastic (8, 3, 3)
RSI (14)
ADX (14, 14)
Charts from Bitstamp, courtesy of TradingView