Bitcoin price increased up to $310 yesterday, yet it declined down to $267 at the time of the writing of this article. As the price is now above the $256 resistance line, we are likely to see it settle above $300 soon.
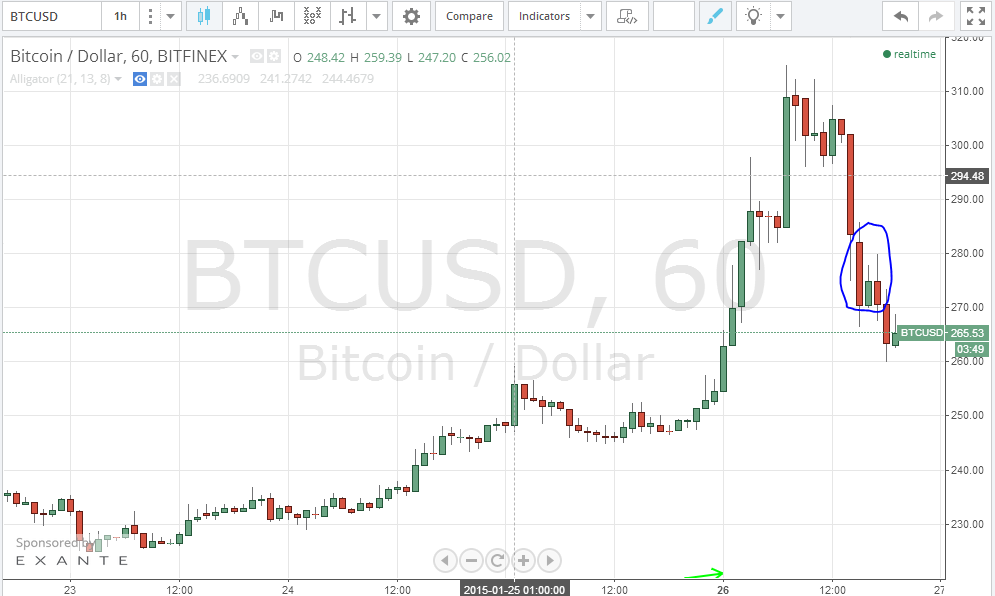
By observing the 1 hour Bitfinex BTC/USD charts from tradingview.com (look at the below chart), we can see how the price burst up to the $300 resistance line in a few hours, before declining again to around $263. This decline reflects the market’s attempt to correct the price as traders are selling to take their profits. By examining the 1 hour charts, we can spot many signals that denote that the bullish wave is still strong and is most probably going to continue. The 1 hour charts show a “stick sandwich” candle pattern (look at the 3 candles inside the blue cloud on the below chart), which means that the bearish wave that pulled the price down from $310 to around $264 is going to reverse during the next few hours.
Bitfinex Bitcoin Price Chart
By studying the 4 hour Bitfinex BTC/USD charts from tradingview.com and plotting the Vortex indicator (VI) on it (look at the below chart), we can still see the blue positive trend line is crossing over the red negative trend line which denotes that the bullish wave is likely to continue supported by the current buying strength of the market.

As the $256 resistance has already been broken and analysis reflects the current strength of the bullish wave, we are likely to see the price settling above $300 soon.
Charts from Bitfinex.