

Bitcoin Price Key Highlights
- Bitcoin’s price has been trending higher, recently completing a corrective wave and reaching one of the Fibonacci extension levels indicated in an earlier article.
- The price is now testing the ascending channel’s resistance visible on the 4-hour chart and might be due for a move back towards support, again.
Bitcoin prices could be in for a quick selloff from here, as risk aversion is spurring demand for the safe-haven dollar, possibly allowing a test of the channel support.
Support at $380?
The 100 SMA is moving above the 200 SMA, indicating that the uptrend might carry on. In addition, the moving averages are right around the bottom of the ascending channel, adding to its potential strength as a support zone.
The $400 level is a good area to book profits for bulls, so this might spur a bit of a drop. In addition, stochastic analysis is indicating overbought conditions and is turning lower, suggesting that sellers are about to take control.
RSI is also on its way down, with a slight bearish divergence, to boot. Notice how bitcoin prices made higher highs from the start of December, while the oscillator made lower highs.
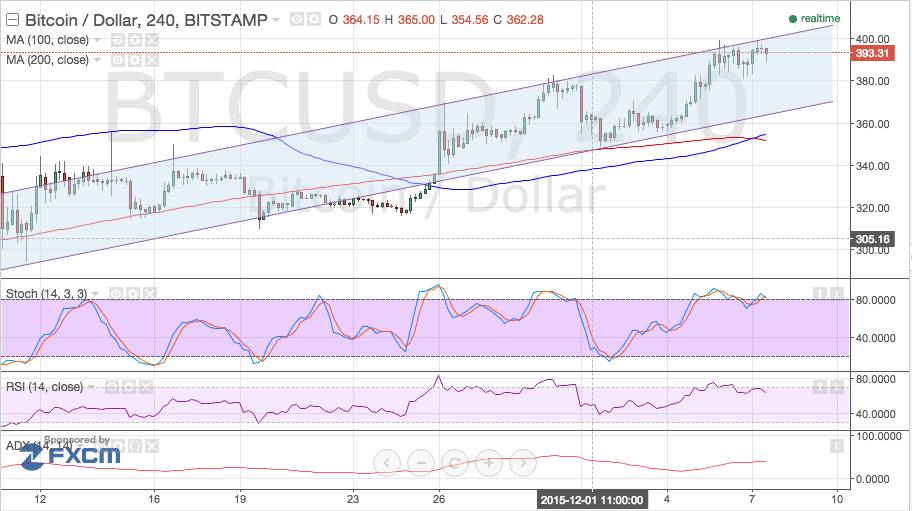

The average directional index is treading slightly higher, indicating that trending market conditions are still in play. Since the Bitcoin price is currently in an uptrend, it’s likely that this could persist.
Commodity prices have been on the decline since the start of this week, weighing on demand for riskier assets such as bitcoins. In turn, this has spurred support for the lower-yielding US dollar, especially since the Fed is on track towards hiking rates later on this month.
Intraday support level – $380
Intraday resistance level – $400
Technical Indicators Settings:
- 100 SMA and 200 SMA
- Stochastic (8, 3, 3)
- RSI (14)
- ADX (14, 14)
Charts from Bitstamp, courtesy of TradingView