Bitcoin Price Key Highlights
- Bitcoin price is still in the middle of a correction from its latest dive, with buyers likely taking it back up to the nearby area of interest.
- The $600 level acted as resistance and support in the past, signaling that there are plenty of traders watching that area.
- Technical indicators are suggesting that the downtrend could carry on but that profit-taking may be in play for now.
Bitcoin price could retrace to the $600 area of interest before resuming its drop to the recent lows.
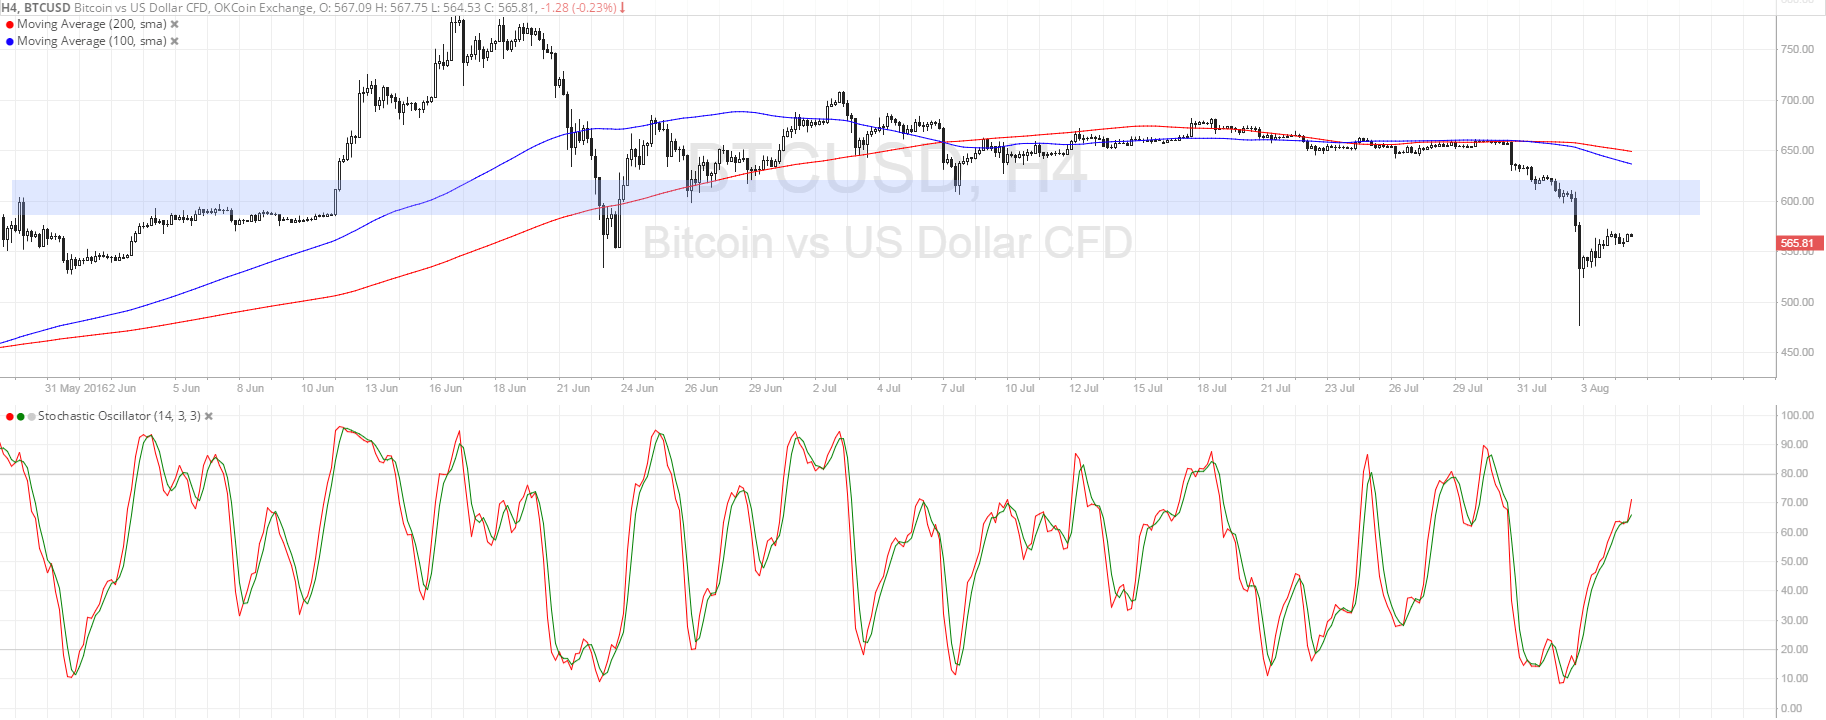
Technical Indicators Signals
The 100 SMA is below the 200 SMA on the 4-hour time frame, which means that the path of least resistance is to the downside and that the selloff could carry on. The gap between the moving averages is widening, indicating that bearish pressure is strengthening.
However, stochastic is still on the move up so bitcoin price could follow suit. This could be enough to take price up to the $600 area of interest or up to the dynamic resistance around the moving averages closer to $650. Selling pressure could return once the oscillator reaches the overbought region and turns lower.

Market Events
Traders still seem to be reeling from the bitcoin exchange hack in Hong Kong, which led to the loss of more than $70 million worth of funds. However, now that investigations are underway and additional security measures were put in place, bitcoin price appears poised for a strong recovery.
Apart from that, a switch to easy monetary policy in the forex market spurred by central bank action appears to be drawing investors back to the cryptocurrency. After all, the recent rate cuts from the Reserve Bank of Australia and the Bank of England could weigh on exchange rates and lead traders to pursue higher returns elsewhere.
The main catalyst for volatility today is the US non-farm payrolls report, as a strong reading could revive Fed rate hike expectations for September and thereby dollar demand across the board. Downbeat results, on the other hand, could keep traders flocking to bitcoin.
Charts from SimpleFX