

We’ve had another pretty strong night in the bitcoin price evening, as the classical head and shoulders pattern translated to some strong downside momentum during the Wednesday night Asian session was negated. Overnight lows of around 226.32 mark a reversal point this morning, and we corrected to highs of 230.50 subsequently, but whether we can recover the lost strength during today’s European session remains to be seen. So, with this said, what are the levels that we are watching in today’s bitcoin price, and where will we look to get in and out of the market according to either our intraday breakout strategy or our intra-range strategy? Take a quick look at the chart below.
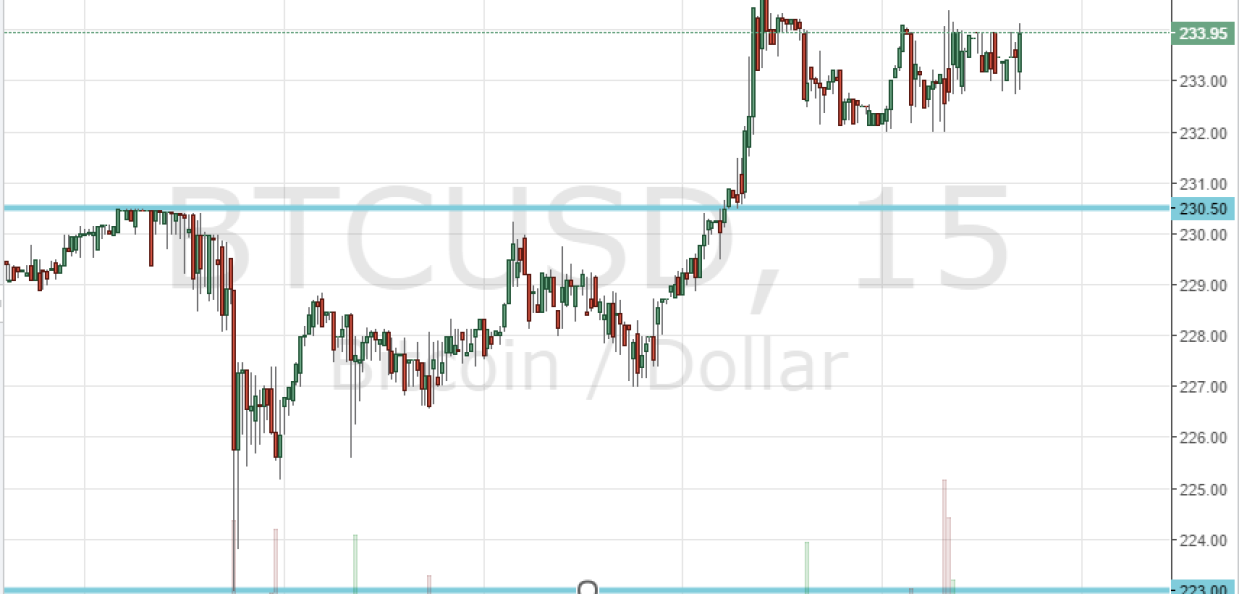
The chart highlights the action we saw overnight, and reveals the bottoming out of the bitcoin price at the aforementioned 226.32 – a level that now serves as in term support during today’s European session. From this level we corrected to recover and reach morning highs of 230.50 – this level now serves as in term resistance for today. These are the two levels that we can be watching.
If we can break above 2, it would suggest a bullish medium-term bias towards an immediate upside target – somewhere around 232. Therefore, a close above in term resistance on the intraday chart would put us long towards this level, with a stop loss somewhere around 229 helping us to maintain a tight but positive risk reward profile on the trade.
Looking the other way, if current resistance holds, and we get a break below 226.32, we will look for a close below this to validate an entry. On this entry, a target of around 223 flat gives us about 2 ½ dollars’ worth of reward, so a stop loss somewhere around 227 will help us to keep things attractive from a risk management perspective.
Charts courtesy of Trading View