

Once again we have seen some pretty volatile action in the bitcoin price during the Asian session. Having declined throughout yesterday evening, from highs around 241.63 on the day, we reach 237.10 shortly before midnight. However, we quickly bounced from this level, and are currently trading around 240 flat – just shy of yesterday’s highs at 241.63. The hope here is that we can get some further volatility during today’s European session, and draw a profit from our intraday strategy as we head into the weekend. So, with this said, what are the levels that we are watching in today’s bitcoin price, and where can we look to get in and out of the markets according to our strategy? Take a quick look at the chart.
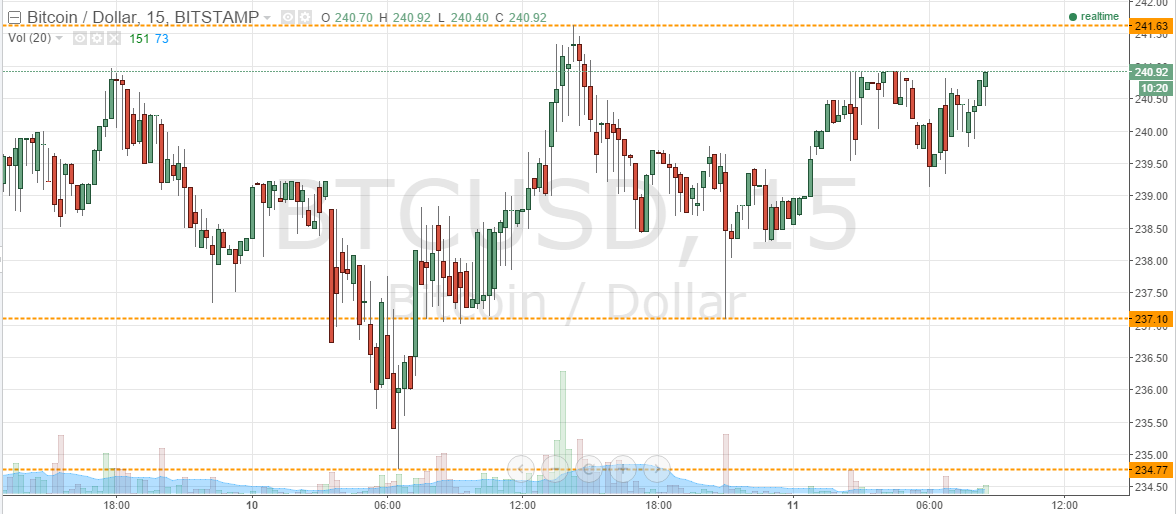

As you see, and as we have already mentioned, we are currently trading between what serves as in term support at 237.10 and resistance at 241.63. These are going to be the two levels that we watch during today’s session.
If we can get a run up towards 241.63, it will give us two options. First, we will look for a break above this level to validate a medium-term bullish entry towards 245 flat. On this trade, a stop loss somewhere around 240 flat will help us to maintain a positive risk reward profile. Looking the other way, we can go short towards in term support on a downside correction, with a stop loss around 242.5 keeping things tight.
On the downside, if we run down towards 237.10, we will simply mirror our potential trades from resistance. In other words, a break below 237.10 will put us short towards a medium-term target of 234.77, while a bounce from 237.10 (in term support) will put us long towards in term resistance at 241.63. On both of these trade, a stop loss approximately $1.5 either side of entry keep things attractive from a risk management perspective.
Charts courtesy of Trading View