So the end of the week is here, and it’s time to take a penultimate look at the bitcoin price market before we kick off the weekend. Price has been pretty volatile across the last few days, and with this volatility has come plenty of opportunity to get in and out of the markets according to our intraday strategy. Earlier this morning we noted that price had dipped a bit overnight, putting the 1,000 target out of reach for a while, but that we might see a boost in volume heading in to the weekend, and that this could push the bitcoin price towards four digits.
We did see something of this sort during today’s session (albeit not quite to the degree required) and we are currently trading just ahead of where we want to be moving into the Friday close.
So, with this mind, let’s take a look at where things stand, and what we are focusing on moving forward. It’s the final analysis of the year, so for those that have been with us throughout 2016, we hope it’s been a good one!
The chart below is a five-minute candlestick chart showing the overnight flat action, and also illustrating the above mentioned breakout and spike into current prices. It’s got our range overlaid in green. As ever, take a quick look at that before we get started, to get an idea of our key range in focus.
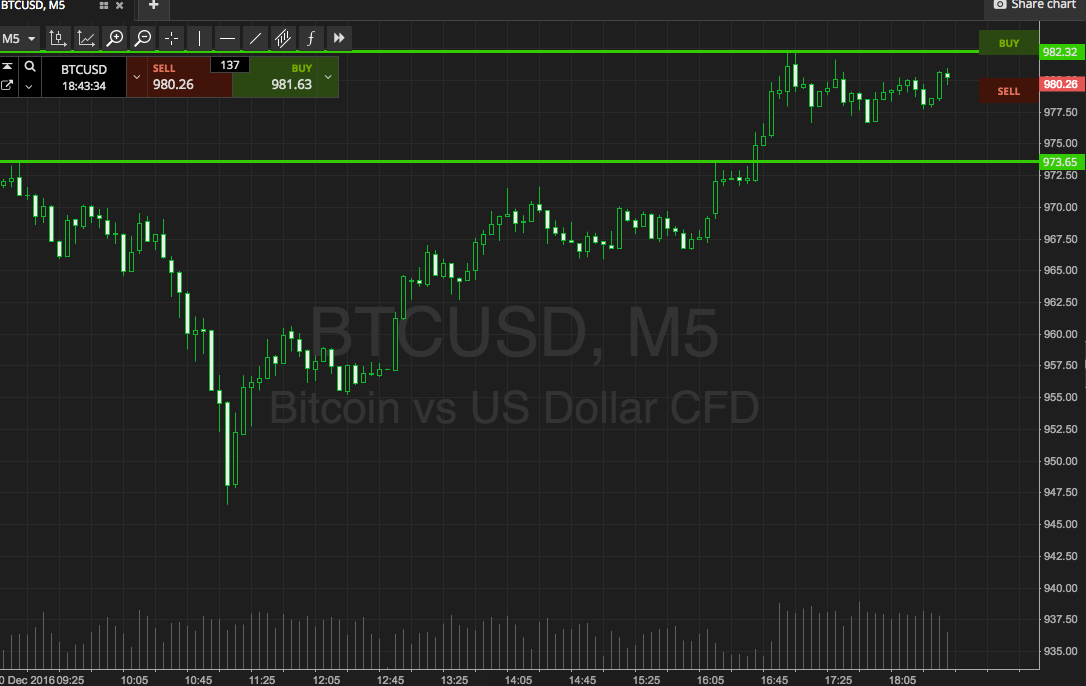

As the chart shows, the range we are looking at is defined by in term support to the downside at 973 flat, and in term resistance to the upside at 982.
We’re going to look to get in towards 990 if price breaks through resistance, and towards 964 if price closes below support. Stops just the other side of the entry define risk on the positions.
Happy New Year!
Charts courtesy of SimpleFX