It’s been a few days since we last looked at the bitcoin price from the five-minute perspective (this author had a bit of time of for Christmas) and price has moved a lot across the period. We said heading into December that things might end up being a little slow – that the low(ish) volume caused by the market inactivity across the wider and more traditional financial assets may filter in to the crypto space. As it turns out, this hasn’t been the case. Things have been pretty volatile, and there’s not been any real dip in volume. You could argue this is a result of the Asian (and specifically, Chinese) participation rates, but let’s not get in to that now. For now, instead, let’s look at a chart and see if we can define some levels with which to move forward.
As ever, the chart below is a five minute candlestick chart, and it’s got our range overlaid. Take a look at that before we kick things off to get an idea of what’s on, and where price stands after its end of year run up.
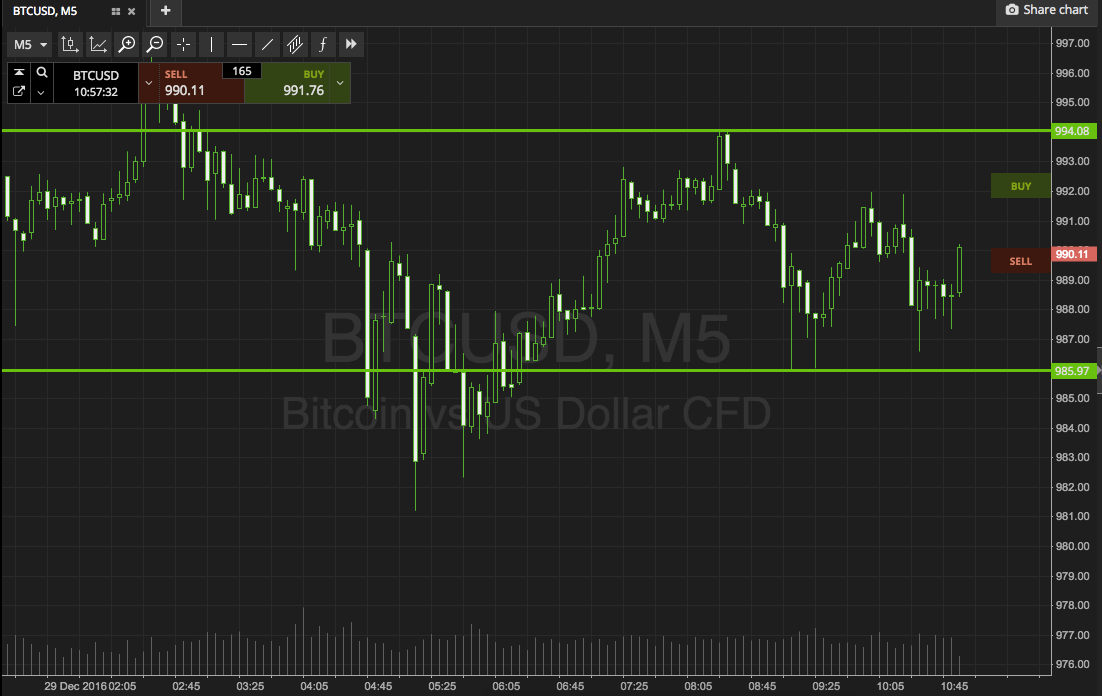

Charts courtesy of SimpleFX