At the end of last week, we noted that much of the action over the last couple of months, i.e. the big moves that have shifted our fundamental bias, have come at the weekend. More specifically, during the Sunday session. This seems counterintuitive – in the more traditional asset markets Sunday is generally a closed out day – but the majority of exchanges in the crypto space operate non stop, so that we would get a bit of volatility ahead of the Asian open on a fresh week makes sense. The weekend just passed was no exception. The bitcoin price rallied into Sunday morning, and hit fresh highs at 412 flat before correcting slightly. The correction didn’t last long, however, and price once again returned to these highs during Sunday evening. Throughout Sunday night, the buyers sold off, and bitcoin fell to overnight lows just ahead of 406. It is in this region we are looking to trade today.
So, with the weekend’s action out of the way, what are we focusing on as we head into a fresh day, and week’s, trading in Europe and the US? Get a quick look at the chart below to first get an idea of our key levels.
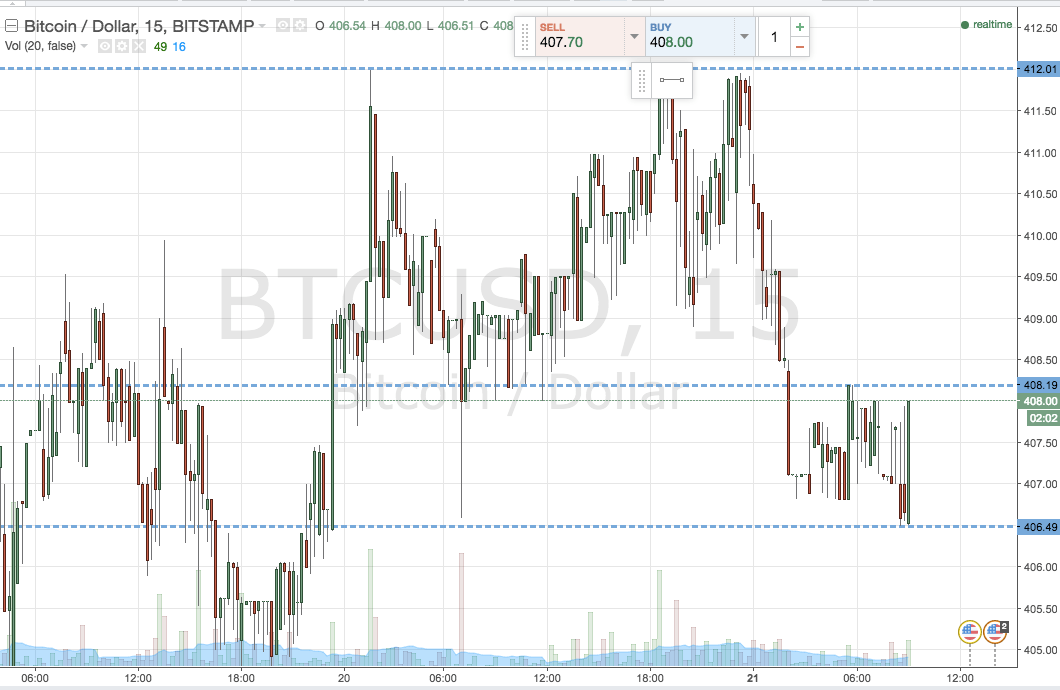

As the chart shows, the range we are looking at this morning is defined by in term support at 406.5 and resistance at 408.5. It’s a very tight range, so we shouldn’t have any problem getting into a breakout trade.
Looking long, a close above support signals a bullish trade towards aforementioned weekend highs of 412 flat. A stop at support (406.5) defines the risk on the trade.
Conversely, a close below in term support will put us short towards the psychologically significant 400 flat. Resistance defines risk on this one, with a stop at 408.19.
Happy trading!
As ever, charts courtesy of Trading View