Yet again, we’ve had a pretty eventful weekend in the bitcoin price. We surmised that we might see some volatility on the Asian open, but actually ended up seeing the most volatile action early Sunday morning. Having gained throughout Saturday to overnight (and intraweek) highs just shy of 450 flat, price took a sharp hit to carve out weekend lows of 425.88 – a level that will feature in today’s trading strategy. Since these lows, we’ve been trending pretty steadily to the side, with what looks to be a slight upside bias heading into today’s European session open.
There haven’t been any major fundamental developments over the weekend, but sentiment seems strong at the moment, and this looks to be what’s behind the recent strength in the bitcoin price. If this sentiment remains, then we could be seeing 500 flat before the week draws to a close. Ahead of this potential milestone, however, there’s plenty of trading to be done on the intraday charts. So, with this in mind, here’s what we are looking at in today’s session. The chart below is a 15 minute, intraday chart, showing action over the weekend and throughout this morning.
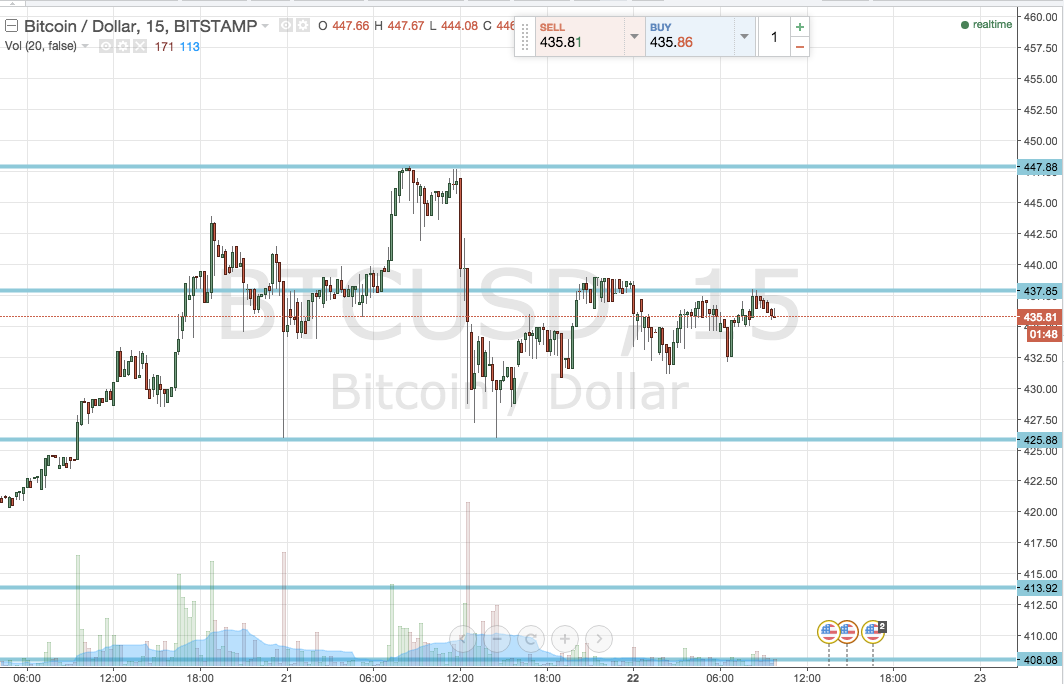

As you can see from the chart, today’s range is defined by the two levels we have already mentioned – intraday highs at the most recent swing peak, 437.85, coming in as in term resistance, and Sunday’s low at 425.88 giving us in term support.
We’ll be trading breakout today, so if we see a close above in term resistance, we’ll look to enter long towards an initial upside target of 447.88. A stop just short of 435 defines risk nicely.
Looking the other way, if we see the bitcoin price close below in term support, we’ll enter short towards 413.92. It’s pretty aggressive, so we’ve got room for a nice wide stop. Somewhere around 430 looks sound.
Charts courtesy of Trading View