It is Monday morning, and time for a look at how we are going to approach the bitcoin price this week as part of a fresh week’s trading strategy. Action over the weekend was relatively flat (something that those who have followed along with our analyses across the last few months will know is pretty unusual) but overnight on Sunday we did see some sustained upside momentum. This momentum has brought us to trade just shy of overnight highs – current level at 591, overnight highs at 594.4 – and it is this run to the upside that will define and underline our strategy today.
So, with this said, and as we head into the Monday morning session out of Europe, here is a look at how we are going to approach the bitcoin price today, and concurrently, how we will ensure any positions that we enter are defined by solid risk management principles.
As ever, take a quick look at the chart below to get an idea of what we’re watching. It is a 15-minute candlestick chart, and it shows action between June 4 to time of writing.
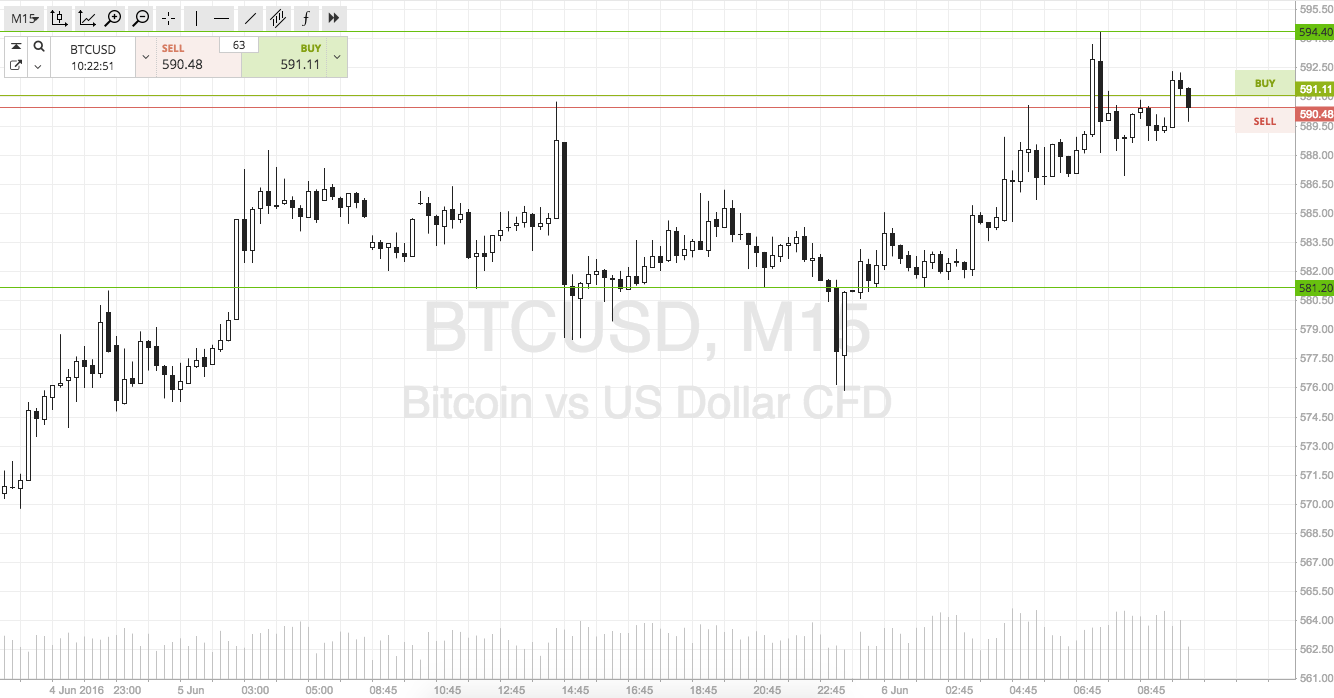

So, as you can see from the chart, the levels that define today’s range are in term support at 581.2 and resistance at the above-mentioned medium-term swing high of 594.4. We are trading just shy of the latter of these two levels as things stand, so we will address the upside potential of today’s strategy first. Specifically, if price breaks above resistance, we will look to enter long towards an initial upside target of 600 flat. A stop loss on this position somewhere in the region of 590 defines our risk.
Looking short, if price breaks below support, it will signal a downside entry towards 574.5. A stop loss at 583.5 keeps things tight from a risk management perspective.
Charts courtesy of SimpleFX