Over the last few months, we have repeatedly noted the big moves in the bitcoin price, during the weekend. Primarily, this is a result of volume out of Asia, but also it seems to be a time at which markets unwind in a particular direction, and this unwinding translates to sustained volatility. This weekend is no different, however, the magnitude of the move altered slightly. Specifically, price broke through the 600 level – a level that we had slated as psychologically significant early last week – and continues to gain strength to reach just shy of 700.
Things like this – while not necessarily a bad thing are far from the norm, however, and so we must be careful going forward. Specifically, from a long-term point of view, chances are we are just ahead of a major correction – perhaps back down as low as 620. 700 is a new key psychological level, and while price is looking like it may test this level, there are plenty of long positions looking to take profits.
So, with this in mind, and as we head into today’s session, what are we looking at in the bitcoin price, and what will we look to get in and out the markets according to our intraday strategy? Take a quick look at the chart below to get an idea of what’s on.
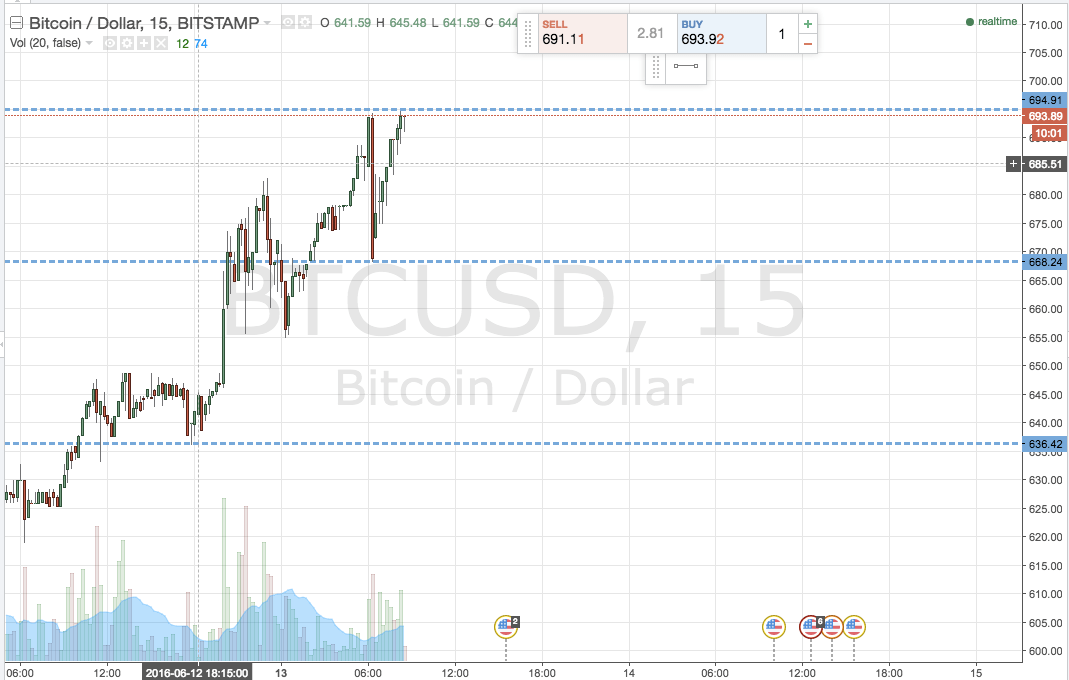

As the chart shows, we have a pretty wide range today (as a result of the weekend action). It is defined by support at 668 and resistance at 694. Intrarange is an option, so long support and short resistance – stop loss just the other side of the entry to define risk. From a breakout perspective, if price closes above resistance we will enter long towards 710.
Conversely, if price closes will support it will signal a short street toward 655. Stop at 672 to keep things tight.
Charts courtesy of Trading View