So that’s another day done, and once again it’s been a pretty busy one. We’ve tried to take advantage of some of the smaller price movements in the bitcoin price over the last few days, and to some extent, it’s worked. There have been a few hiccups, but by focusing on near term targets and avoiding our intrarange strategy, we’ve been able to get what we want out of the markets without having to put too much back in.
Tonight, we’re looking to continue this trend.
Things have been up and down, but we’re seeing some steady increases now, and we broke through our predefined resistance a little earlier today to compound our bullish bias and give us a nice profit on the break.
With this said, and taking into consideration that which we saw today, let’s take a look at what we are focusing on tonight from a key levels perspective.
The chart below is our standard five-minute denominated representation of the last twelve hours or so worth of action in the bitcoin price, and it’s got our range overlaid for clarity.
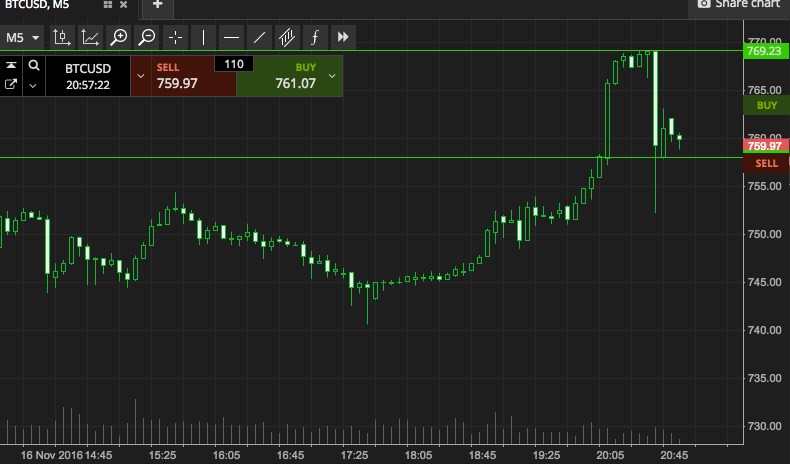

As the chart shows, the range we are looking at is defined by in term support to the downside at 759 and in term resistance to the upside at 769. This is a little wider than this morning, but it’s still not wide enough for us to go at price with an intrarange strategy, so just as this morning, we’re sticking with a scalp breakout approach.
So, if price closes above in term resistance, we will get in long towards an upside target of 775. A stop loss on this one somewhere in the region of 767 works to define our risk on the position.
Conversely, a close below support puts us short toward 752. Stop at 762 to kill off the trade in the event it goes against us.
Charts courtesy of SimpleFX.