That’s the European session done, and it’s time to take a look at how we can interpret action today to put together a strategy for this evening. Things have been pretty dull over the last few weeks, but this week, things picked up considerably, and we’ve seen numerous breaks throughout the intraday session and we’ve been able to get in and out of the markets according to a few different variations of our strategy.
Let’s hope we can carry on with this this evening.
So, here goes.
Take a look at the chart before we get started, to clue up on the levels in focus and the range we are targeting for tonight’s session. We’re back in on the narrow timeframes, and we’re looking at scalp entries on breaks of our key levels.
The chart is a five-minute chart with around twelve hours’ worth of action illustrated. Our range is overlaid in green.
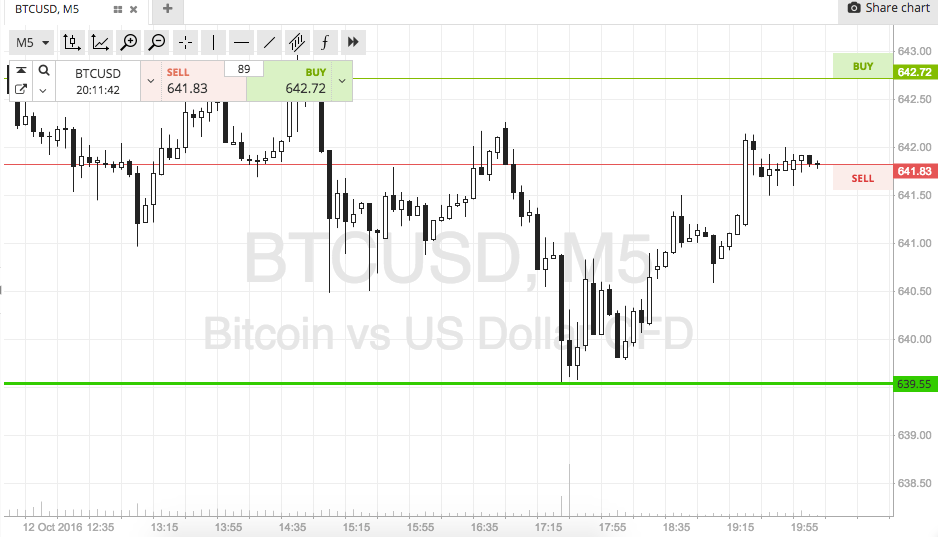

As the chart shows, the range we are targeting is defined by in term support to the downside at 639 and in term resistance to the upside at 645. With about X dollars worth of range to play with, there’s probably just about enough room to go at price intrarange, but we’re going to stick with breakout only this evening, Anyone fancying a bit more of an aggressive evening can go in for an intrarange approach.
Looking at breakout, if price closes above in term resistance, we are going to get in long towards an immediate upside target of 650. A stop loss on this position somewhere in the region of 643 works well to define our downside risk.
Conversely, a close below support will signal a downside entry towards 634. Again we need a stop loss, and 641 looks good for this one.
Let’s see how things play out…
Happy Trading!
Charts courtesy of SimpleFX