

Let’s kick off this afternoon’s analysis with a chart. The chart below shows the framework we overlaid on the bitcoin price this morning, as well as maintaining the key levels we put in place as our target entry points.
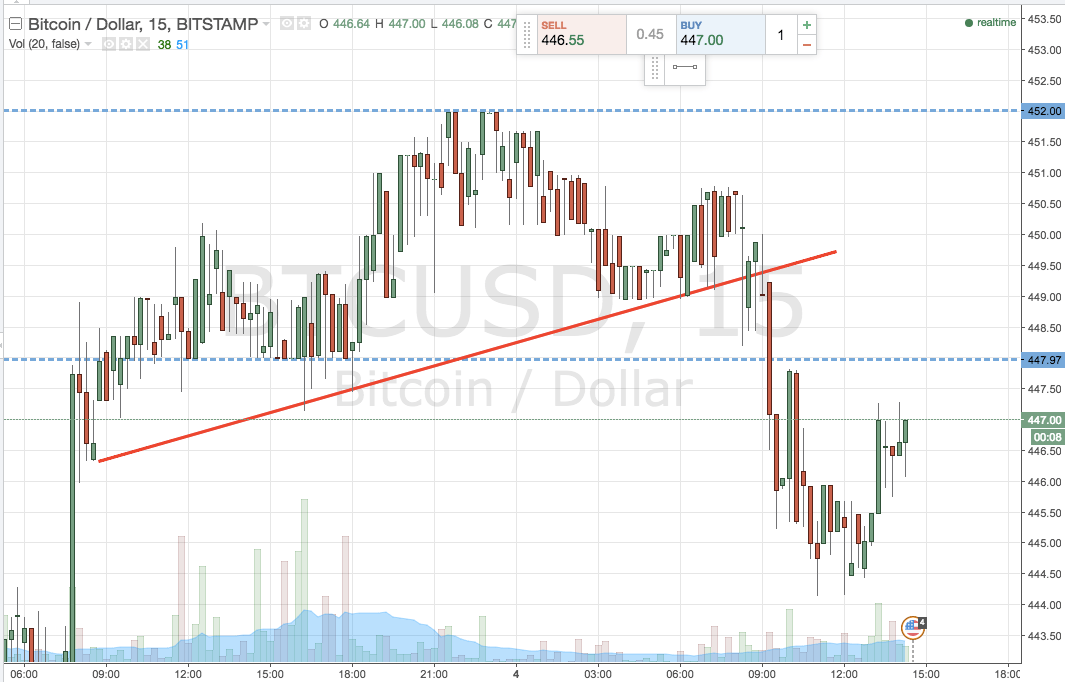

As the chart shows, price broke through the lower trend line of the upward sloping channel shortly after we published our analysis, and subsequently through the level we had slated as in term support. The latter break put us in a short trade towards a downside target of 443. As the chart shows, price ran down towards this level initially, but reversed just shy, and now trades pretty much back within range. This makes things a little tough for this evening’s session. We aren’t able to get in a fresh trade due to the caveat in our breakout strategy rules, but it’s looking increasingly like we are going to get a near term stop hit. We don’t want to be left without an entry opportunity if we get stopped out in the next half hour or so, so we are going to outline a framework that incorporates today’s action, and see if we can get in according to the revised framework post stop hit.
Of course, if price doesn’t take out our stop, and reverses to head back down towards our target, we’ll stay out of the revised framework. The chart below shows the new setup.
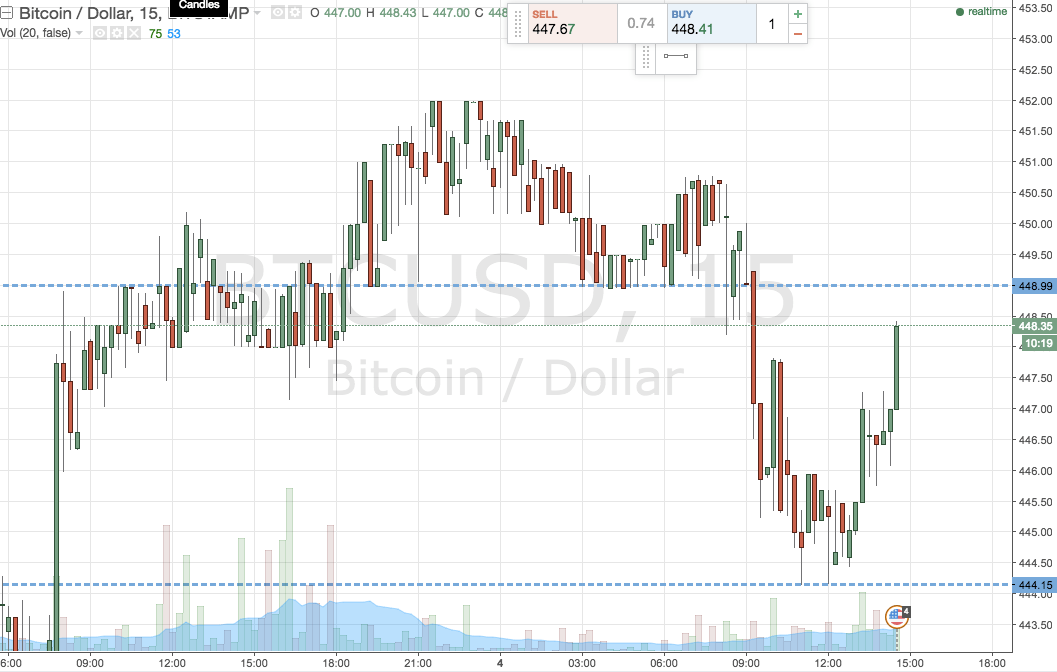

As the chart shows, the revised entry levels are in term support at 444 flat, and in term resistance at 449 flat.
If the bitcoin price breaks below the former, in term support, we will look to enter a short position towards an initial downside target of 438. A stop at 446 defines risk.
Looking north, a close above resistance signals long towards 455. Stop at 446.50 to keep things tight on the risk side of the position.
Charts courtesy of Trading View
Header Image NewsBTC