So we are closing in on the end of the week, and it’s been a pretty interesting one so far. The bitcoin price kicked things off on Monday on a relatively somber note, trading flat and sideways throughout the early sessions of the week. Throughout Tuesday evening, however, things started to move, and price hasn’t really looked back since. We are now trading just ahead of 1,100, which is a level that many said we might not reach again for some time after price ran up and subsequently corrected mid January.
Exactly where things go from here, it’s tough to say.
If we can maintain the upside momentum, then we will almost certainly see a break of 1,100, and this cold facilitate a longer term upside run and bring 1,200 in to play as a potential target throughout the remainder of February.
Anyway, we will see. For now, let’s just get some short term levels outlined, and see if we can take advantage of them as and when they hit or miss.
So, as ever, take a look at the chart below before we get in to the detail. It’s a five-minute candlestick chart, and our range in focus is overlaid in green.
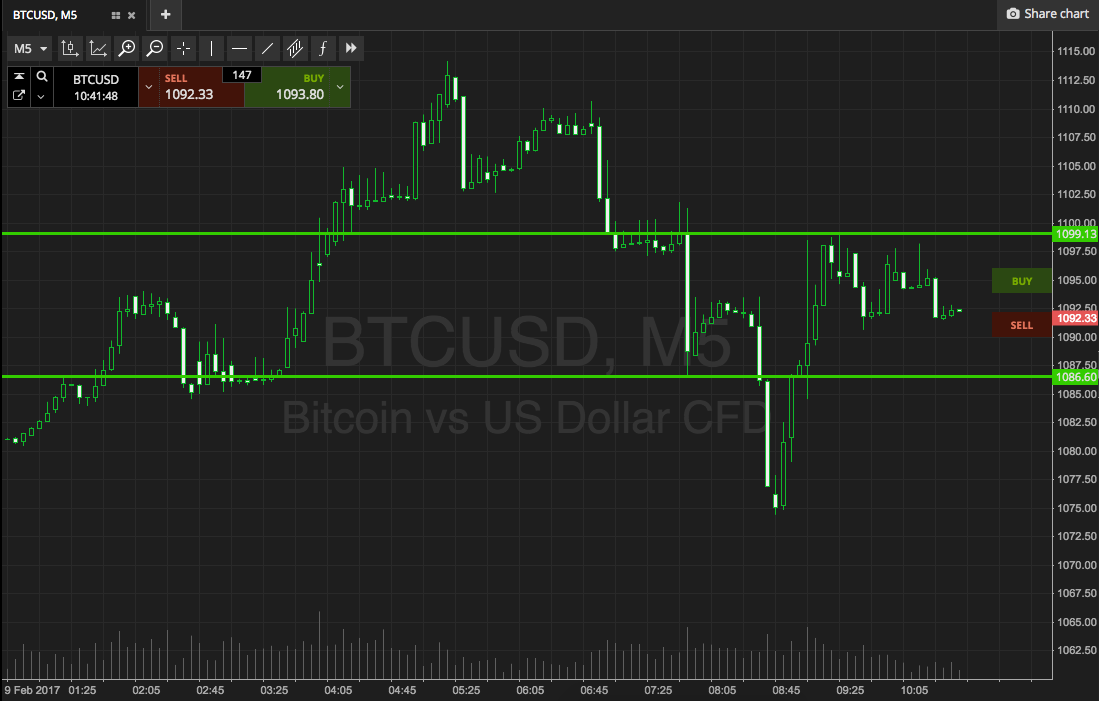

As the chart shows, the range we are bringing to the table for today’s European morning session is defined by support to the downside at 1086 and resistance to the upside at 1099. We’re using 1099 instead of 1086 because it should give hit easier as an upside target. If we use 1100, we may not reach the ask price before exiting the trade (as due to spread, it will sit a little higher than 1100 flat). Intrarange is on, long at support and short at resistance.
For breakout entries if price breaks resistance, we will get in long towards 1110. Conversely, a close below support will put us short towards 1078.
Let’s see how things play out.
Charts courtesy of SimpleFX