When we published the first of our twice daily bitcoin price watch pieces this morning, we noted that – based on the volatility seen in the markets over the weekend – we would be a widen our standard range link in the region of $10 or $15, and in doing so, bring both our breakout and our intra-range strategies into play. We also highlighted a triangle that had formed on the 15 minute chart, and suggested that this triangle could represent a certain level of consolidation – and in turn – signal a return to the upside momentum on its breaking.
Action has now matured throughout the Monday morning session in Europe, and as we head into the afternoon in the US, and the amount, into the Asian session tonight, what has this action told us about the bitcoin price, and how can we interpret it and use it in this evening’s analysis? As ever, take a look at the chart below to get an idea of what’s on, and the range we are looking at tonight.
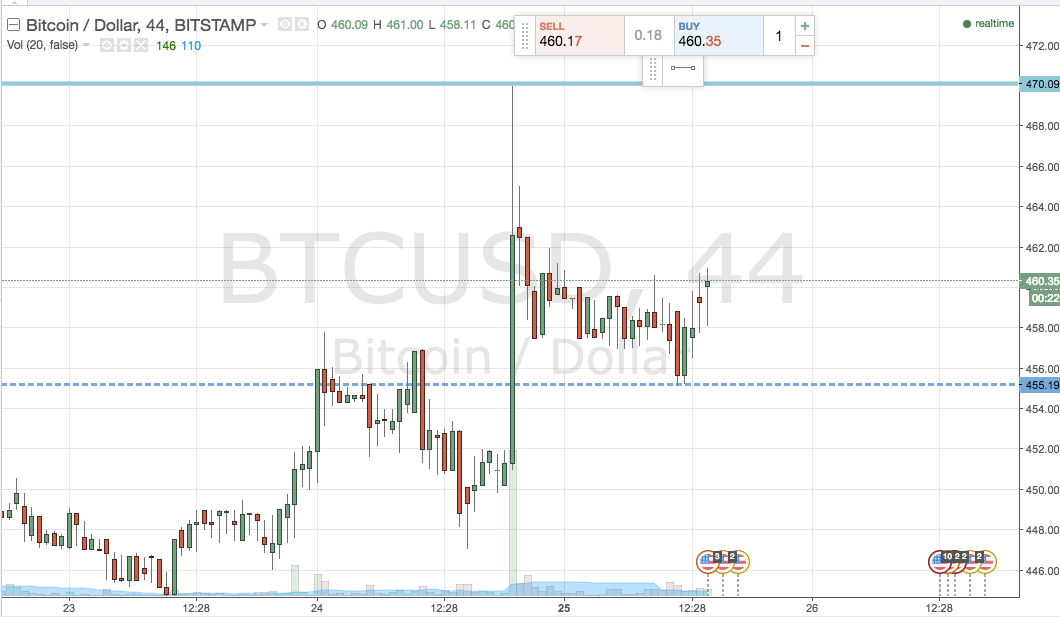

As the chart shows, the range were looking at tonight is defined by support at 455 flat, and resistance at 470 flat. Just as with this morning, the range wide enough to play intra-range on any sideways action. Long at support and short at resistance, stop just the other side of the entry.
From a breakout perspective, a close above resistance will signal a long trade towards 477. A stop loss on this one at 466 works well. Looking the other way, a close below support signals short towards 450. Again we need to stop loss, and somewhere around 459 looks good.
So that’s what we are looking at this evening. Hopefully we’ll get a rehash of the volatility seen over the weekend, and in turn, an excuse to get into the markets and draw another intraday profit on the fifteen minute timeframe. Let’s see what happens.
Charts courtesy of Trading View