So we are off on a fresh week of trading in the bitcoin price and it’s already looking as though it’s going to be a pretty interesting one. Price over the weekend continued to make fresh highs and it looks as though the bulls remain firmly in control right now. There is, of course, the chance that things will turn around and that we will see a correction near term but, if we do, it’s likely to be a relatively small one given that – as things stand – there isn’t too much in the way of fundamental catalysts to push things down.
Anyway, let’s get some levels outlined that we can use to go at price today if and when things move during the session.
Before we get started, take a quick look at the chart below. It is a one-minute candlestick chart and it has our key range overlaid in green.
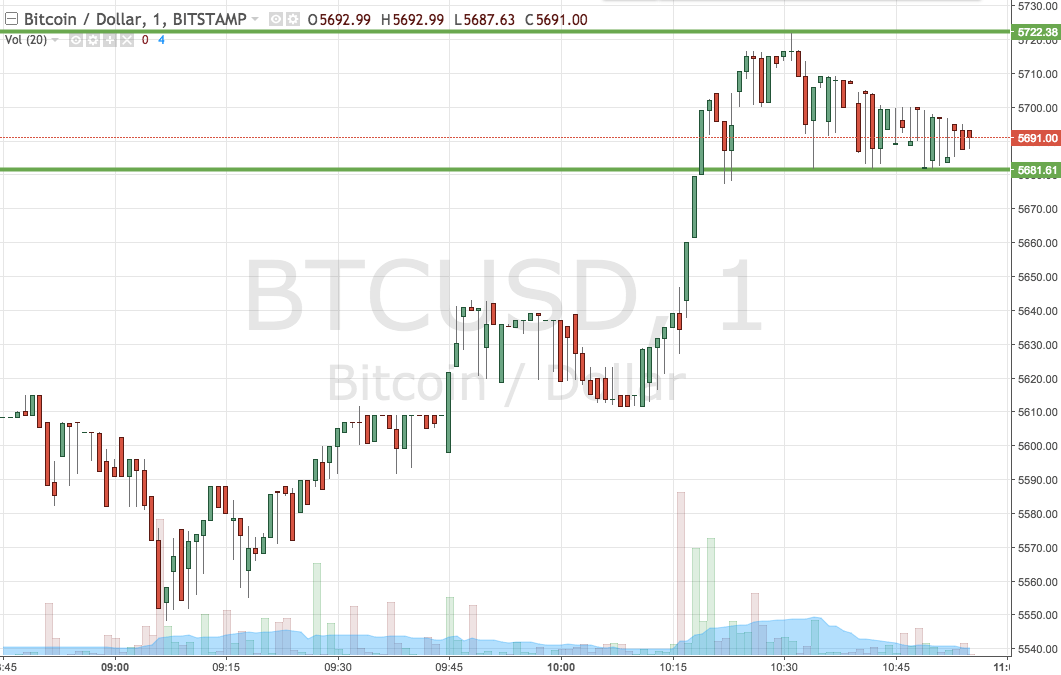

As the chart shows, the range we are using for the session today comes in as defined by support to the downside at 5681 and resistance to the upside at 5722. We are going to stick with our breakout strategy for the time being, simply because the range is a little too tight for us to go at price with an intrarange strategy and it’s looking as though momentum is going to dominate the session, meaning breakout trades are more attractive.
So, if we see price break above resistance, we will watch out for a close above that level to validate an upside entry towards a target of 5750. A stop loss on the trade at 5713 will ensure we are taken out of the position in the event of a bias reversal.
Looking the other way, if price closes below support, we will enter short towards 5645. A stop loss on this one at 5705 looks good.
Chart courtesy of Trading View