Well, we asked for a bitcoin price breakout, and a breakout we got. The chart below illustrates it nicely, and we’ll get to that and our key levels shortly, but first, a bit of background. Price has been relatively flat for the past week or so, trading sideways within a circa ten dollar rage defined by 740-750 or thereabouts. In our twice daily analyses, we’ve noted on a couple of occasions that there’s only so much sideways trading we can do, and price generally coils up for a breakout when action looks as it did recently. Once it breaks, we generally then see a pretty sharp (and just as importantly, sustained) move in the direction of the break. It’s just a matter of setting up our key levels and waiting.
Well, that was pretty much exactly what we got early morning out of Europe this morning.
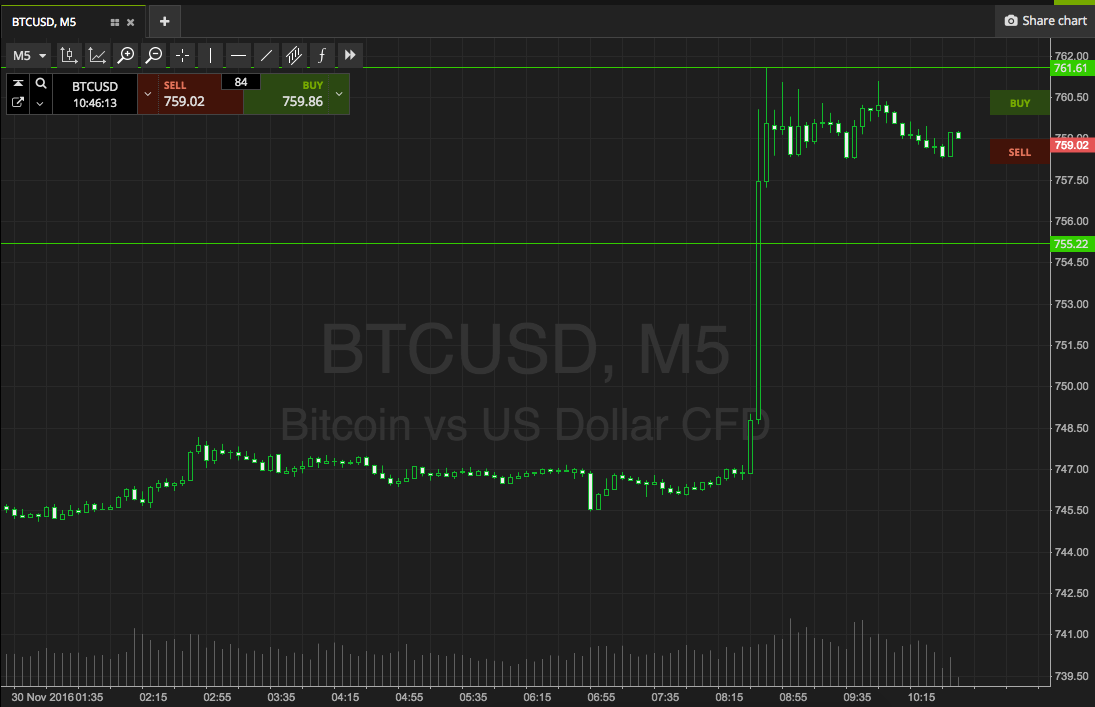
Price wound up and then broke to the upside on the five minute charts, and as it broke (a clean break through our resistance, followed by a nice tidy candlestick close and – by proxy – an entry signal for us) it ran up to, and through, our upside scalp target.
Easy profit, quick turnaround, no choppy action – the perfect trade.
So, what’s on for today?
Well, price is consolidating right now, but with any luck this consolidation precedes a fresh break. We’re going to go at the bitcoin price with a range defined by support to the downside at 755, and resistance at overnight highs at 761, and see where that takes us.

Standard breakout strategy in play – long on a close above resistance towards a target of 770. Short on a close below support aiming for 747. A stop loss on both positions just the other side of the entry (say, two or three dollars) should ensure we are taken out of the trade in the event of a bias reversal.
Happy trading!
Charts courtesy of SimpleFX