So we’ve made it to the end of the week, and what an interesting one its been. Action has been volatile across the board, and the bitcoin price has given us numerous opportunities to get in and out of the markets according to our intraday strategy, both on the long and the short side of the market. There’s still the European session and the US session to go, however, before things draw to a close for the weekend (of course, beyond that, we’ve still got the weekend volume to go at) and so let’s set up against today’s markets in an attempt to pull some more cash out of the market and close out on a high.
The chart below is a five-minute intraday chart showing the last twelve hours (actually a little more) worth of action in the bitcoin price, and illustrates nicely a short term representation of some of the up and down volatility that we have seen across the last week. It’s got our range for today overlaid on price, so take a look at that before we get started to pick up an idea of our key levels.
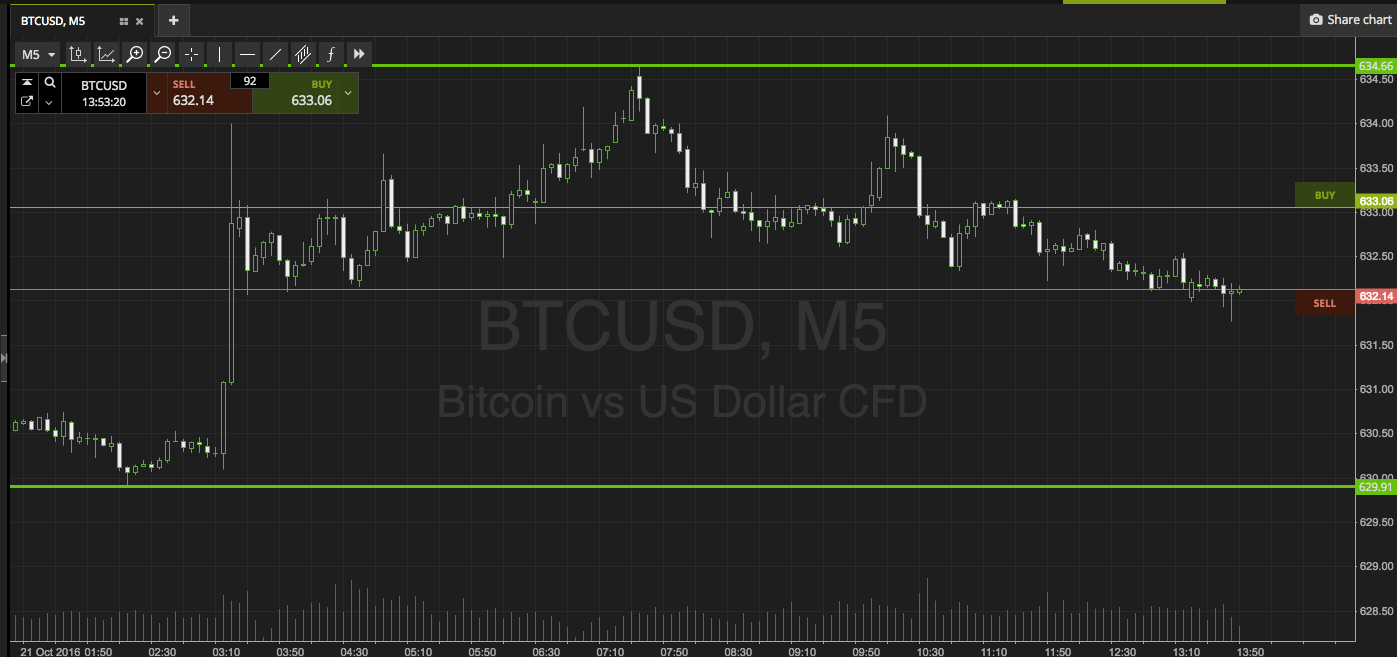

As the chart shows, the range we are targeting for our entries today is defined by in term support to the downside at 629, and in term resistance to the upside at 635 flat. Our strategy for the session today out of Europe is pretty simple. If we see price close above resistance, we are going to get in with a five-dollar target and a two dollar stop. Tis translates to a take profit at 640 and a stop at 623. Conversely, a close below support puts us in short towards the exact same framework. That is, a target of 624 and a stop at 631.
Let’s see how things play out.
Happy trading!
Charts courtesy of SimpleFX