Well, things haven’t quite played out as we might have hoped they would this morning. Things were a little flatter today that we’d thought they were going to be, and the bitcoin price is currently trading a little bit down on the region we were looking at a little earlier on. That doesn’t mean our 800 target is out of the question, just that we’re probably going to have to wait a little longer before we get into our 800 breakout momentum play.
So, as we set up against the markets on last time on this Friday evening out of Europe, and as we head into the weekend beyond, let’s try and outline some key levels, and see if we can take advantage of any volatility that comes our way.
As ever, take a quick look at the chart below to get an idea of what we are focusing on, and where we are looking to get in and out of the markets according to the rules of our intraday breakout strategy. It’s a five-minute candlestick chart with our primary range overlaid in green.
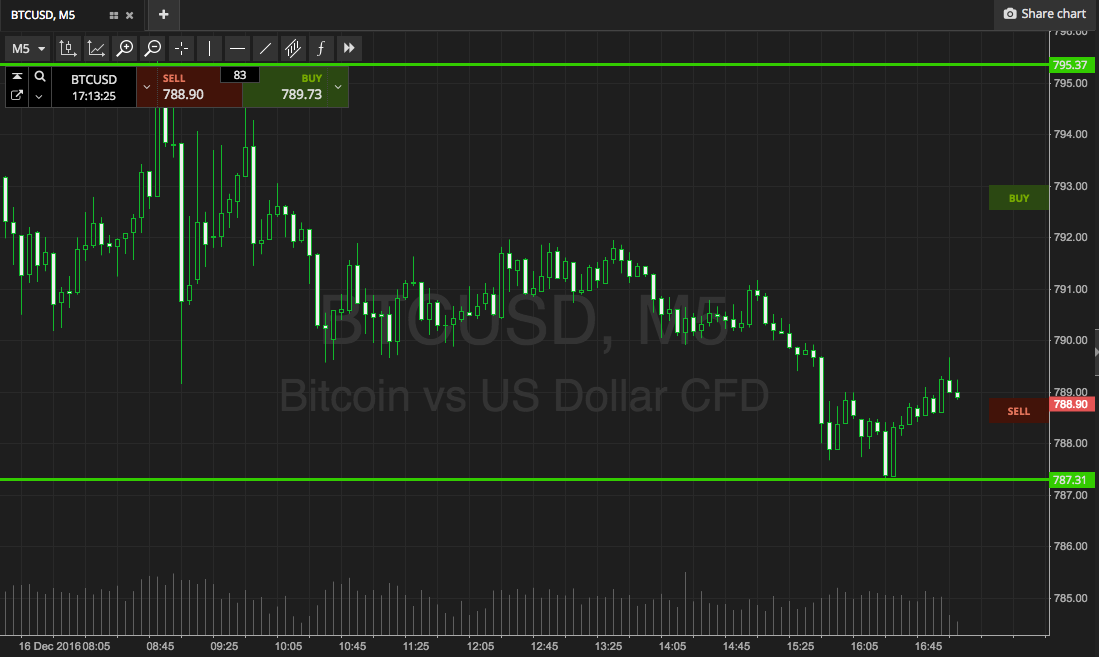

As the chart illustrates, we’re looking at a range defined by in term support to the downside at 787, and in term resistance at 795 flat. The range is just about wide enough for us to go at things with an intrarange approach, so we’ll look to get in long towards resistance on a bounce from support, and short towards support on a correction from resistance.
If price breaks through our resistance level, we’ll get in long towards an immediate upside target of 805. Conversely, a close below support will put us short towards 780 flat. A stop loss just the other side of the entry on both counts will ensure we get taken out of the trade in the event of a bias reversal.
Let’s see how things play out.
Charts courtesy of SimpleFX