For the second of today’s bitcoin price watch analyses, we are going to kick things off with a chart. The chart below shows the action price put forward this morning, with our earlier framework overlaid. To start off then, take a quick look at the chart.
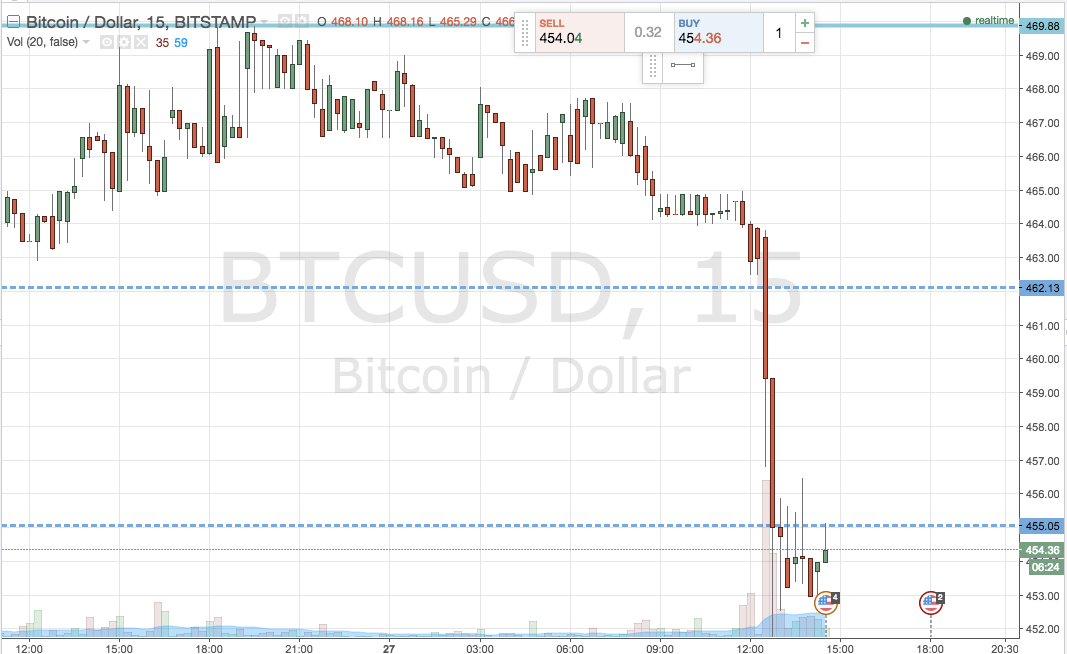

As the chart shows, action went against our initial upside bias, and broke through the level we had slated as support to the downside shortly before lunchtime in the UK. After this break, a sustained downside run carried price to our downside target, pretty much directly after the break in question. While we obviously prefer upside trades (as these serve to benefit our longer-term holdings as well as our short-term speculative efforts), our breakout strategy is designed to draw benefit from action in either direction, and this downside trade is a welcome addition midweek.
With that out of the way, and as we head into the US afternoon session, and beyond that into the Asian session tonight, here are the levels that we are watching in the bitcoin price going forward. As ever, take a look at the chart below to get an idea of our range. It’s a 15-minute candlestick chart showing today’s action.
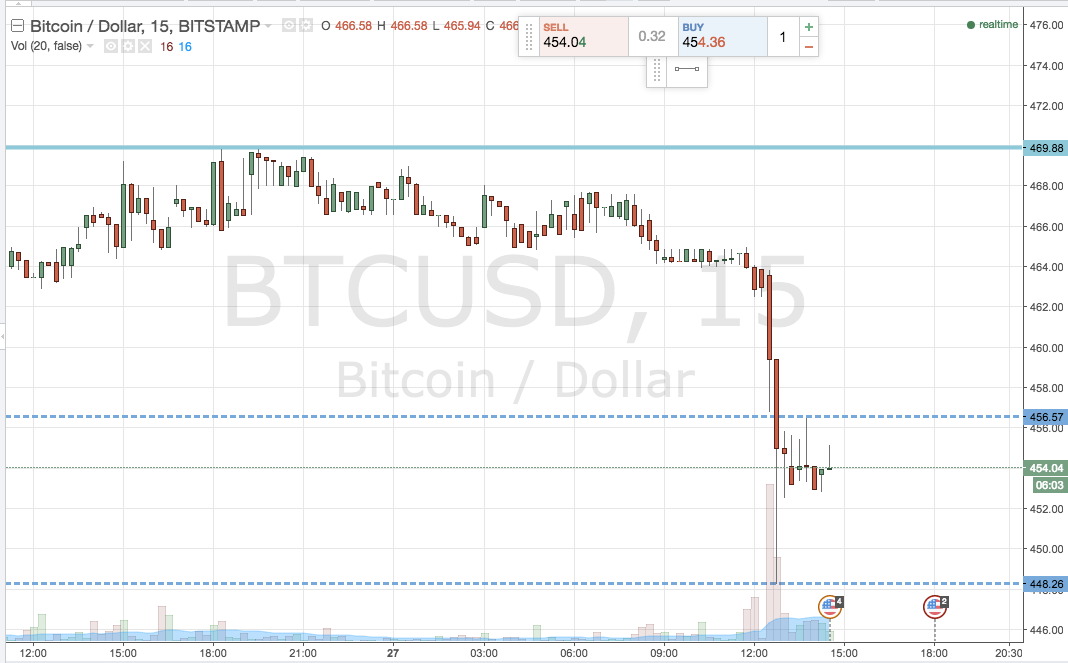

As the chart shows, for the remainder of today’s trading, we are going to narrow our range to support at 448 and resistance at 456.These represent the most recent swing low and swing high respectively.
If price closes back above resistance, it will give us an opportunity to enter longer towards an upside target of 470. This is quite an aggressive trade, which means we’ve got plenty of room for risk management. A stop loss somewhere in the region of 450 maintains a positive risk reward profile on the trade.
Looking the other way, a close below support signals short towards 440. A stop here at 451 defines risk.
Charts courtesy Trading View