We’ve come to the end of the week, and it’s been a pretty boring one from an intraday perspective. The bitcoin price doesn’t seem to want to breakout of a circa ten to twenty-dollar range, and this has proven difficult to navigate using our relatively tight intraday range on the five and the fifteen minute charts. Last night we suggested we could go at things with an intrarange approach to try and diversify away from just using our breakout scalp approach, but it didn’t make too much difference. During the Asian session we got in a short term scalp trade to the downside on a bearish break, and it paid off, but not to too great an extent.
Anyway, enough moaning.
Let’s look forward to the European session today, the US and Asians sessions a little later on, and the weekend beyond.
We are going to set up against price in exactly the same way as we always do – define a range and trade when price breaks out of that range in the direction of the break. Tight targets, predefined risk, in and out according to our rules.
So, before we get started on the session, take a quick look at the chart below to get an idea of what’s on. The chart is a five-minute intraday candlestick chart showing the last twelve minutes’ worth of action, and it’s got our range for the day overlaid in green.
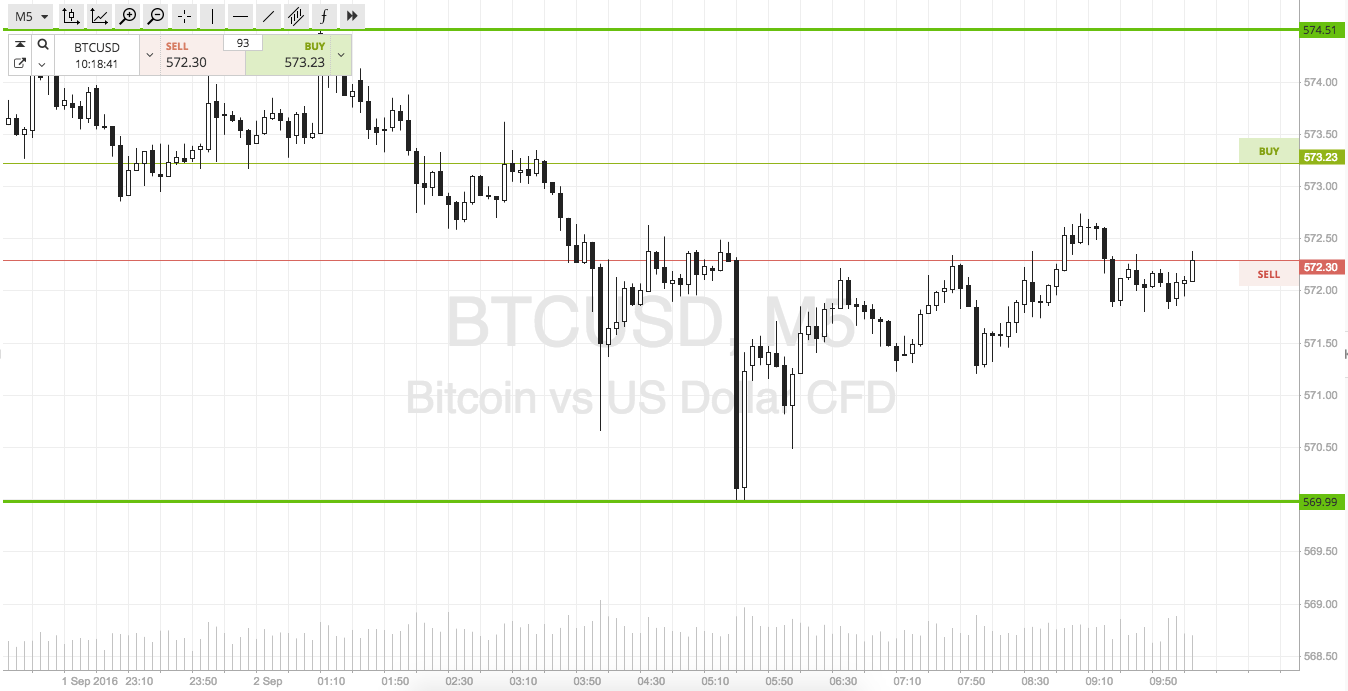

As the chart shows, our range for today is defined by in term support to the downside at 570 flat, and in term resistance to the upside at 575. There’s not enough room for intrarange today.
On breakout, if price closes above resistance we will get in long towards an upside target of 580 flat. A stop at 573 defines risk.
Conversely, a close below support signals short towards 565.
Happy Trading!
Charts courtesy of Trading View