Well we’ve made it to the end of the week, and things have gone so so in our bitcoin price trading. We are pretty much net flat on the market after last night’s session, and go into today’s European session with plenty to go at. Volatility overnight got us in to the markets on a short position, and then a little earlier this morning we managed to get in for an opposite trade, one to the upside on a breakout. Both took profit, so we managed to make back the losses accrued during the Wednesday evening and Thursday morning session. We’ve got about half of the European session left to go at, and the US morning starts shortly, so let’s get things started for today’s session.
As ever, get a quick look at the chart below to get an idea of the key levels we are focusing on. It’s an intraday five-minute candlestick chart, and it’s got our key levels overlaid in green. 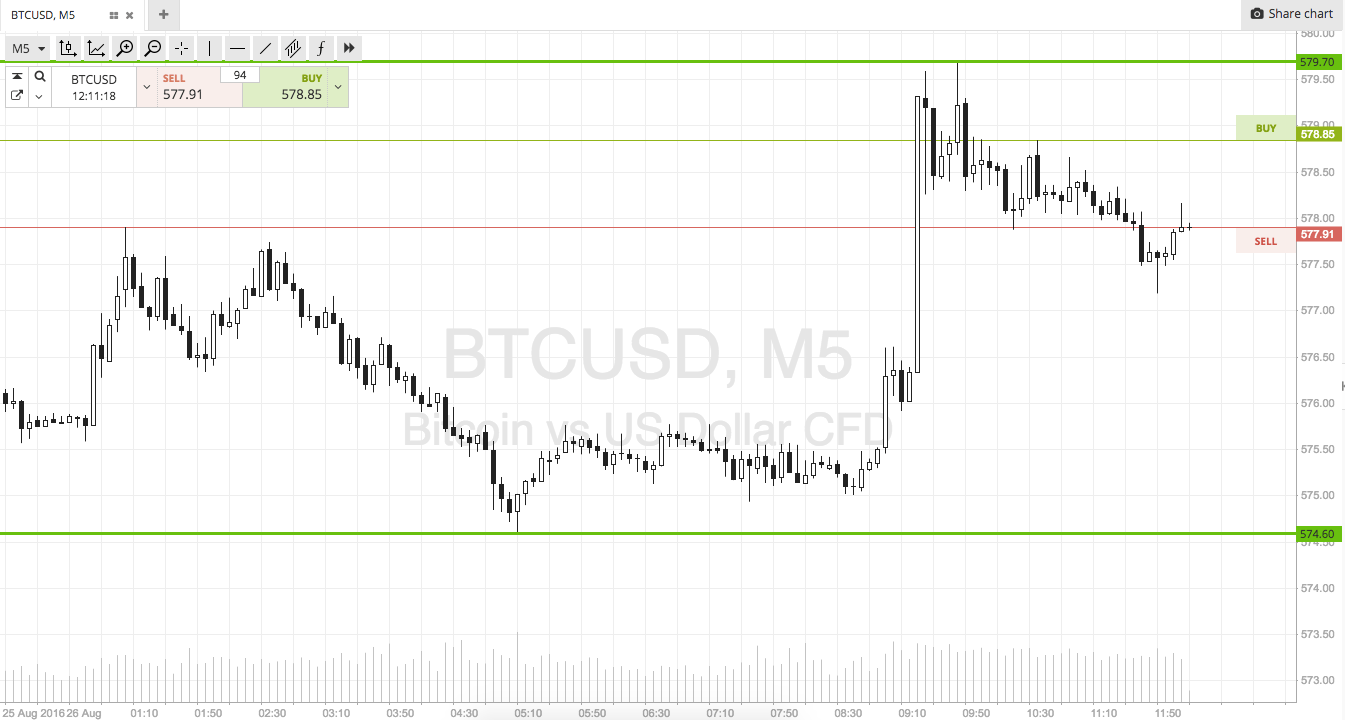

So, as the chart shows, we are looking at a range defined by in term support to the downside at 574 flat, and in term resistance to the upside at 579. That’s a reasonable range, but just as has been the case over the last few days, not quite wide enough to go at with an intrarange strategy.
Looking at our breakout approach, we are going to look to get in long on a break (and a close) above resistance with an immediate upside target of 586. A stop loss somewhere in the region of 576 looks good to define the risk on this one.
Looking the other way, if price breaks below support we will get in short towards a downside target of 568 flat. Again we need a stop loss to ensure we are taken out of the trade in the event of a bias reversal. 576 flat looks good.
Charts courtesy of SimpleFX