So Friday is here, and unfortunately – as yet – we’ve not seen price hit the magic 800 mark. It’s not too big a deal, we’re pretty certain we will see it hit at some point, but chances are that the early close in the traditional financial asset markets, as well as the fallout volume impact we are likely to see on the back of the Thanksgiving break in the US, will hinder any run up during today’s session. That doesn’t mean we won’t see any tradeable action, however, so we’re going to set up against the markets anyway to see what we can do.
So, with this in mind, and as we move forward today, let’s try and get some levels identified for our intraday strategy. As ever, take a look at the chart below to get an idea of what happened overnight, and to get familiar with our focus levels before we get going.
The chart is a five-minute candlestick chart, and it’s got our key levels overlaid in green.
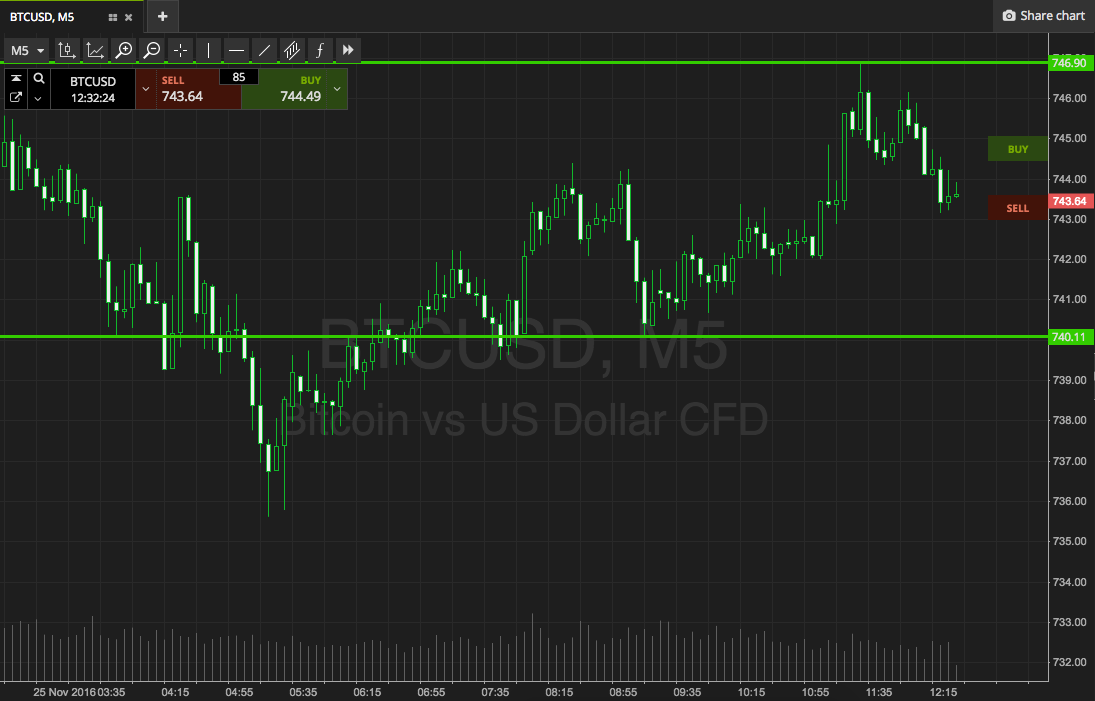

As the chart shows, the levels in focus for today’s session are in term support to the downside at 740 flat, and in term resistance to the upside at 747. These levels represent the most recent swing low and high respectively, offer us a pretty well defined range to go at today.
We’re going to bring both our intrarange and our breakout strategies to the table, so if price remains within range, we’ll look to get in long on a bounce from support and short on a correction from resistance. Both trades target the opposing key level, and a stop just the other side of the entry defines risk.
If price closes above resistance, we’ll get in long towards 753. Conversely, a close below support will signal short towards 730 flat.
Happy trading!
Charts courtesy of SimpleFX