

So we are just about to kick off a fresh week in our bitcoin trading, and action over the weekend gave us plenty to ponder going into today’s session. We saw quite a lot of volatility, some sustained, some not, and managed to get in and out of the markets according to our predefined parameters (those which we highlighted on Friday) and draw a profit. With this in mind, and as we head into a fresh week’s trading, what are the levels we are watching in the bitcoin price, and where will we look to get in and out of the markets if we get a repeat of the volatility we saw over the weekend and in turn – some sustained momentum in the current price? As ever, take a quick look at the chart below to get an idea about levels in focus. It is an intraday chart, with a 15 minute candlestick timeframe, showing somewhere in the region of the last 24 to 48 hours worth of action.
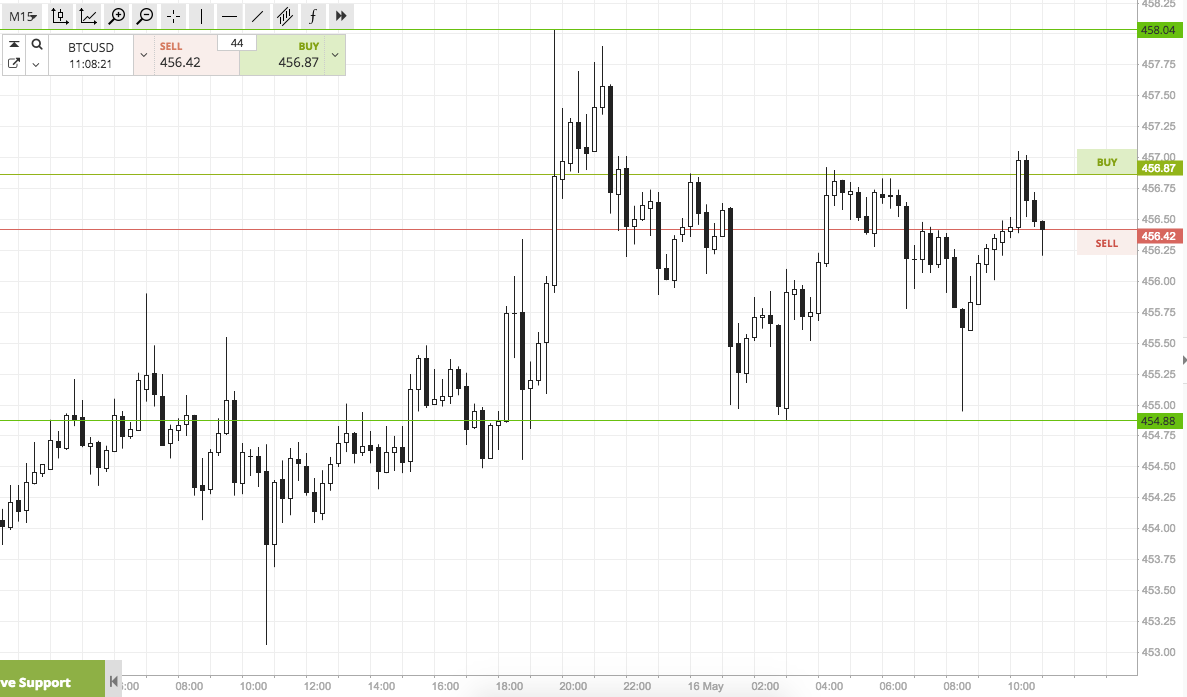

As the chart shows, the levels we are focusing on for the first part of this morning’s session are in term support at 455 flat, and in term resistance at 458 to the upside. Both of these levels represent some of the most recent swing points, with the former being the latest swing low and the latter the latest swing high.
So, from a breakout perspective, if price closes above resistance we will look to enter a long position towards an initial upside target of 465. A stop loss on this one somewhere in the region of 457 will maintain a positive risk reward profile on the trade.
Looking the other way, if price closes below support, it will signal a downside entry towards a target of 450. Again a stop loss is necessary, and 456 looks good.
As a quick aside, will be focusing primarily on our breakout strategy, this morning rather than on intrarange. This may change this afternoon if we manage to widen up our range on any volatility.
Charts courtesy of SimpleFX.
Image via NewsBTC