We are closing in on the end of the European session and it’s time to take the second of our twice daily looks at action in the bitcoin price. If we see price break the $10,000 level today, it’s going to be a big day and one that many will remember for considerable amount of time to come.
With this said, however, we’ve got to stay focused on our intraday short-term action so as to try and avoid getting caught out on any added volatility if and when the big break comes.
So, without further ado, let’s jump straight into the markets and try and get some levels in place that we can use to both draw a profit from the market and protect ourselves at the same time.
As ever, take a quick look at the chart below before we get started so as to an idea where things stand and where will be looking to jump in and out of the markets if things move as expected. The chart is a one-minute candlestick chart and it has our primary range for this evening overlaid in green.
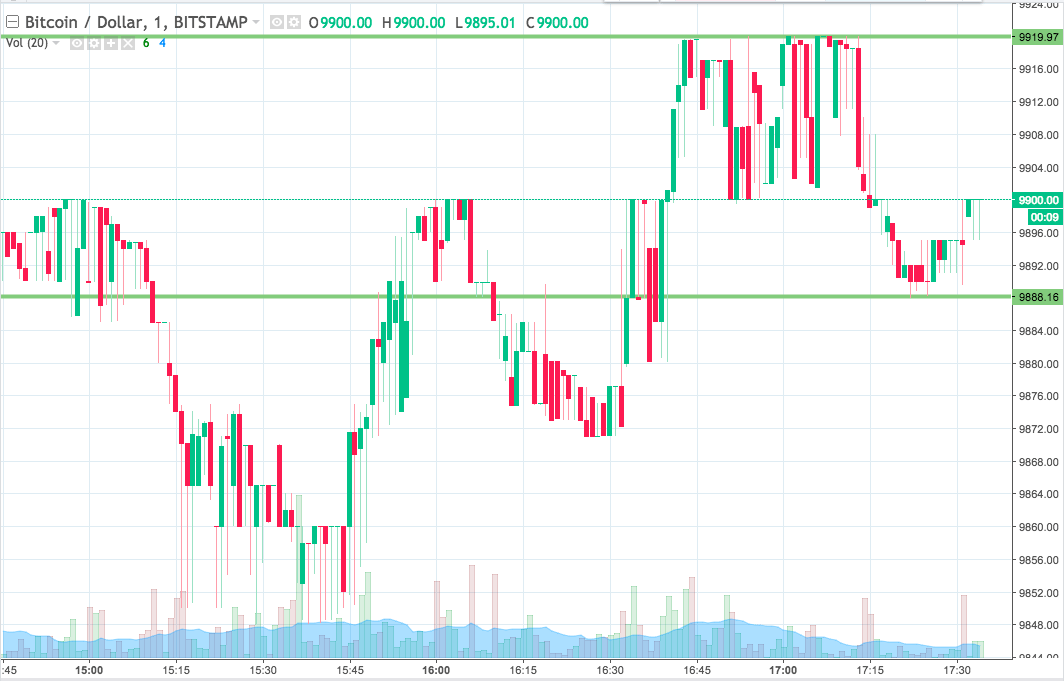

As the chart shows, then, the range we are looking at for the session this evening comes in as defined by support to the downside at 9888 and resistance to the upside at 9919.
If we see price close below support, it will signal a downside entry. On the trade, we will set up a target of 9840 and we will use a stop loss at 9900 to kill off any risk.
Looking the other way, a close above resistance will signal a long entry towards an immediate upside target of 9970. A stop loss on this one at 9900, once again, works well.
Let’s see how things play out during the session and we will revisit tomorrow morning.
Charts courtesy of Trading View
Edit:
For a bit of nostalgia, take a look at this piece from January 2015.
We called it…