First up, take a look at the chart below. It shows the action seen overnight in the bitcoin price, in line with the framework we overlaid as part of yesterday evening’s analysis.
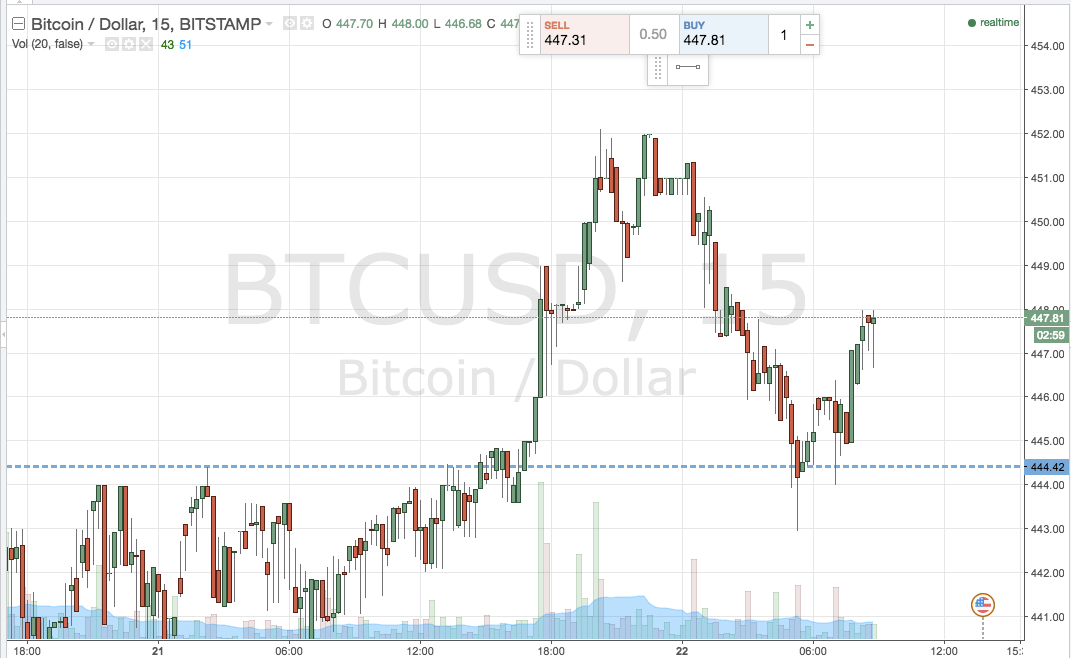

As the chart shows, action last night broke through our in term resistance level shortly after we published the second of our two analyses, and having done so, quickly ran up to reach the level we had slated as an initial upside target at 450 flat.
Having broken through our target, price reversed at peak highs of circa 452, and dipped to once again test our broken resistance, but this time as support.
It held pretty firm, and this morning’s action has primarily comprised a bounce from this resistance come support, to bring the bitcoin price to trade where it does, around 447.
So, with this said, and taking into account the action we’ve seen so far today in the bitcoin price, what are we looking to trade going forward, and where can we look to get in and out of the markets according to our intraday strategy if things go our way? Take a quick look at the chart below to get an idea of our refined range. As with the previous, it’s a fifteen-minute candlestick chart, but this time with an edited framework to reflect the most recent action.
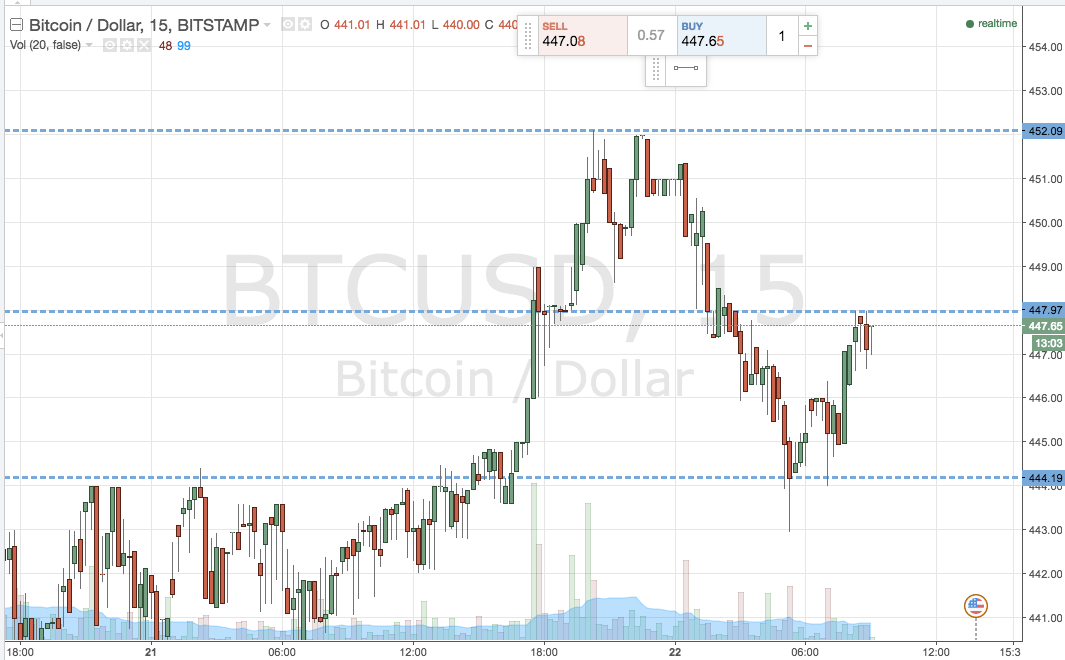

As the chart shows, the levels we are focusing on for today’s session are in term support at 444 flat, and in term resistance at the mist recent swing point at 448 flat. It’s a tight range, so we’ll be looking at our breakout strategy only for now.
A close below in term support will signal short towards an initial downside target of 440 flat, with a stop at 446 to define risk on the position.
Looking to the upside, a close above resistance will signal long towards overnight highs at 452. Stop at 445 flat.
Charts courtesy of Trading View