
It’s taken a few days, but we finally got some decent momentum in the bitcoin price – momentum that we were able to get in on and draw a profit from the markets overnight. Action throughout the majority of the week left us in a position where we had to try and draw some intrarange profits from sideways action, but that didn’t really materialize. We’ve got one full European session left before we head into the weekend, and with any luck, the volatility we saw overnight will filter through to this morning’s activity. If it does, we’ll be ready with a breakout framework – that is, ready to get in and out according to our strategy rules.
Before we get into the details, one quick note. We’ve seen plenty of action over the weekends of late, and this weekend will likely be no different. Often it comes in the form of a sharp move, either across the Sunday morning session or as the Asian markets open for a fresh week (late evening in Europe and evening in the US). As such, we’ll be looking to set up against any potential move a little later on this evening.
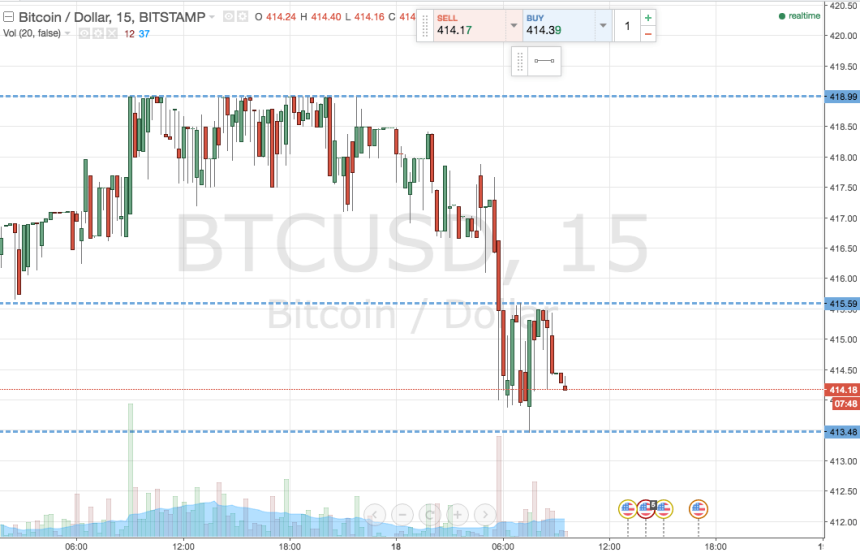
For now, however, let’s focus on the present. The chart below is a 15-minute intraday chart, highlighting the range we are looking at today.

As the chart shows, the range we are focusing on for today’s session is defined by in term support at 413.48) overnight lows and the most recent swing point) and in term resistance at 415.59.
If the bitcoin price breaks and closes above the upper parameter, we’ll look to enter long towards an initial upside target of 419 flat. A stop at 414.5 defines the downside risk.
Looking short, a close below in term support will signal an entry towards 410 flat. This one’s a little tighter, and a stop at 415 keeps things equally tight from a risk management perspective.
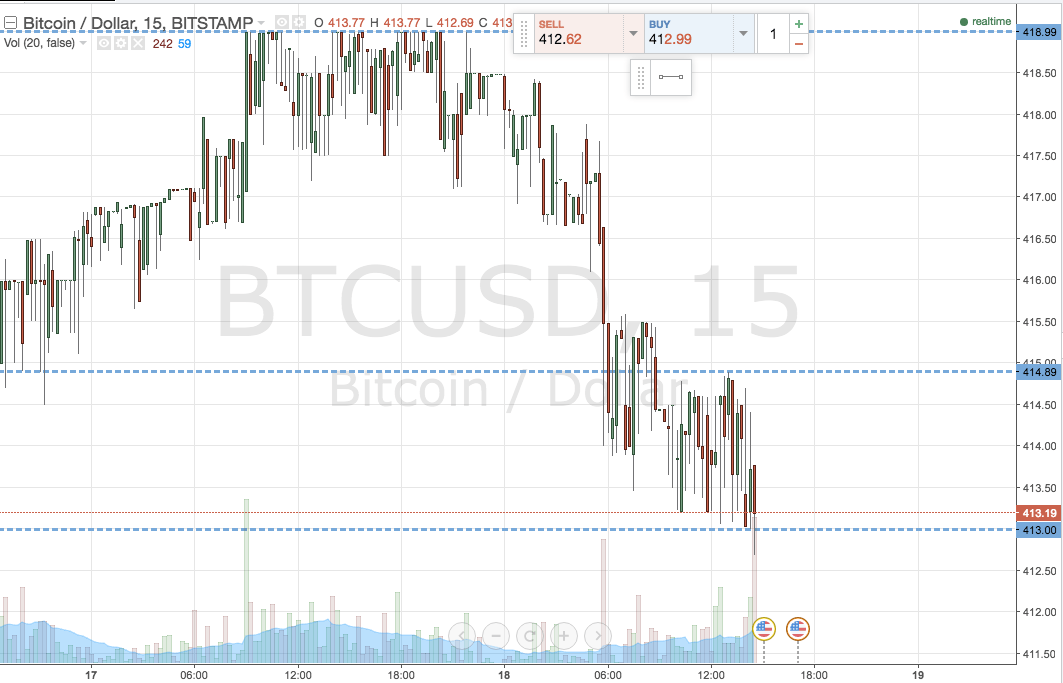
Charts courtesy of Trading View