It’s Monday morning, and a brand new week awaits in the bitcoin price. The last week or so was pretty interesting – things ramped up mid-week, and price carved out a few fresh highs. We also saw some temporary corrections, but none large enough to negate the upside momentum, and we closed out on Friday with what looked like a pretty good chance of reaching the 800 mark over the weekend. We noted, however, that the markets seemed to be slowing a little heading into Friday evening, and that this might be indicative of price taking a little bit longer to breakout from a consolidatory range than perhaps we’d prefer.
As things turned out, this latter suggestion proved correct, and the bitcoin price is still hovering around the mid 700s, having corrected a little throughout the Sunday session.
Anyway, let’s see if we can take advantage of the action with some solid key level placement during today’s session.
As ever, take a look at the chart below to get an idea of where we are looking to trade today.
The chart is a five-minute candlestick chart and our range is overlaid in green.
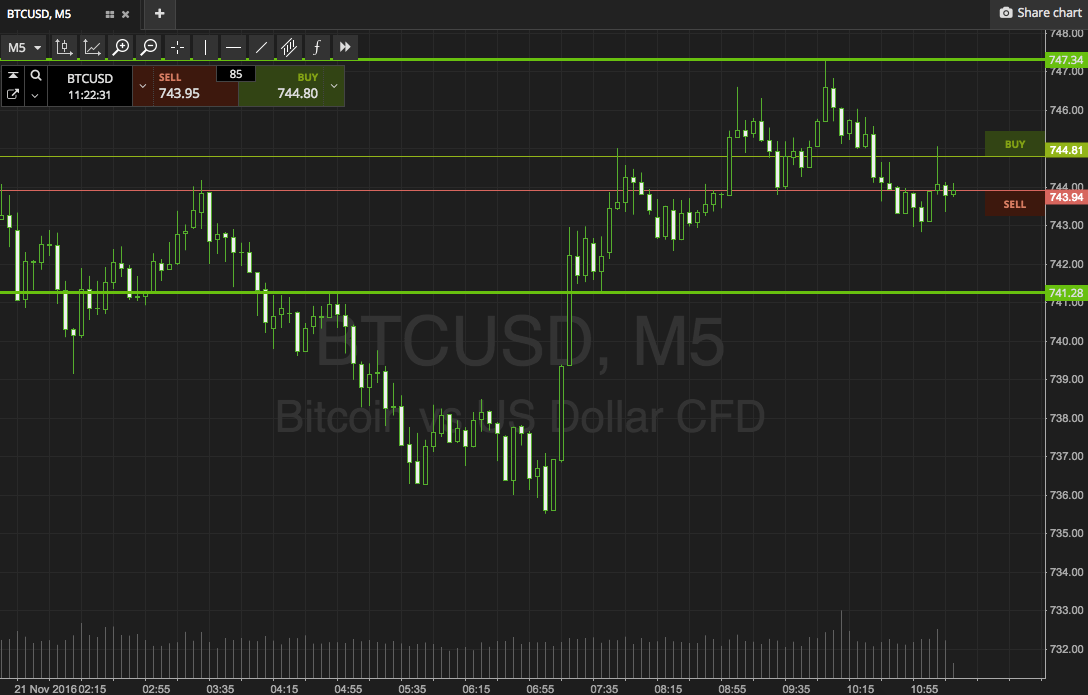

As the chart illustrates, we are looking at a range defined by in term support to the downside at 741 flat and in term resistance to the upside at 747.
The range is probably a little too tight to go at price with a intrarange approach, so we will be looking at things from a breakout perspective only today.
Specifically, if we see price break above in term resistance, we will look to get in long towards an immediate upside target of 755 flat (assuming we see a close above the key level). Conversely, if price breaks below in term support, we will get in towards 734. Stops just the other side of the entry levels define risk on the positions.
Happy trading!
Charts courtesy of SimpleFX