Yesterday afternoon we published a piece highlighting the day’s action in the bitcoin price, and offering up the levels that we considered important as far as forming an intraday bias was concerned. We noted that the bitcoin price had range for the majority of the day, but that the breaking of either in term support or resistance would indicate a respective bearish or bullish bias, and that any such break would signal an entry for us here at NewsBTC. Action has now matured overnight, and – as we head into Friday’s European session – what are we watching? Take a quick look at the chart.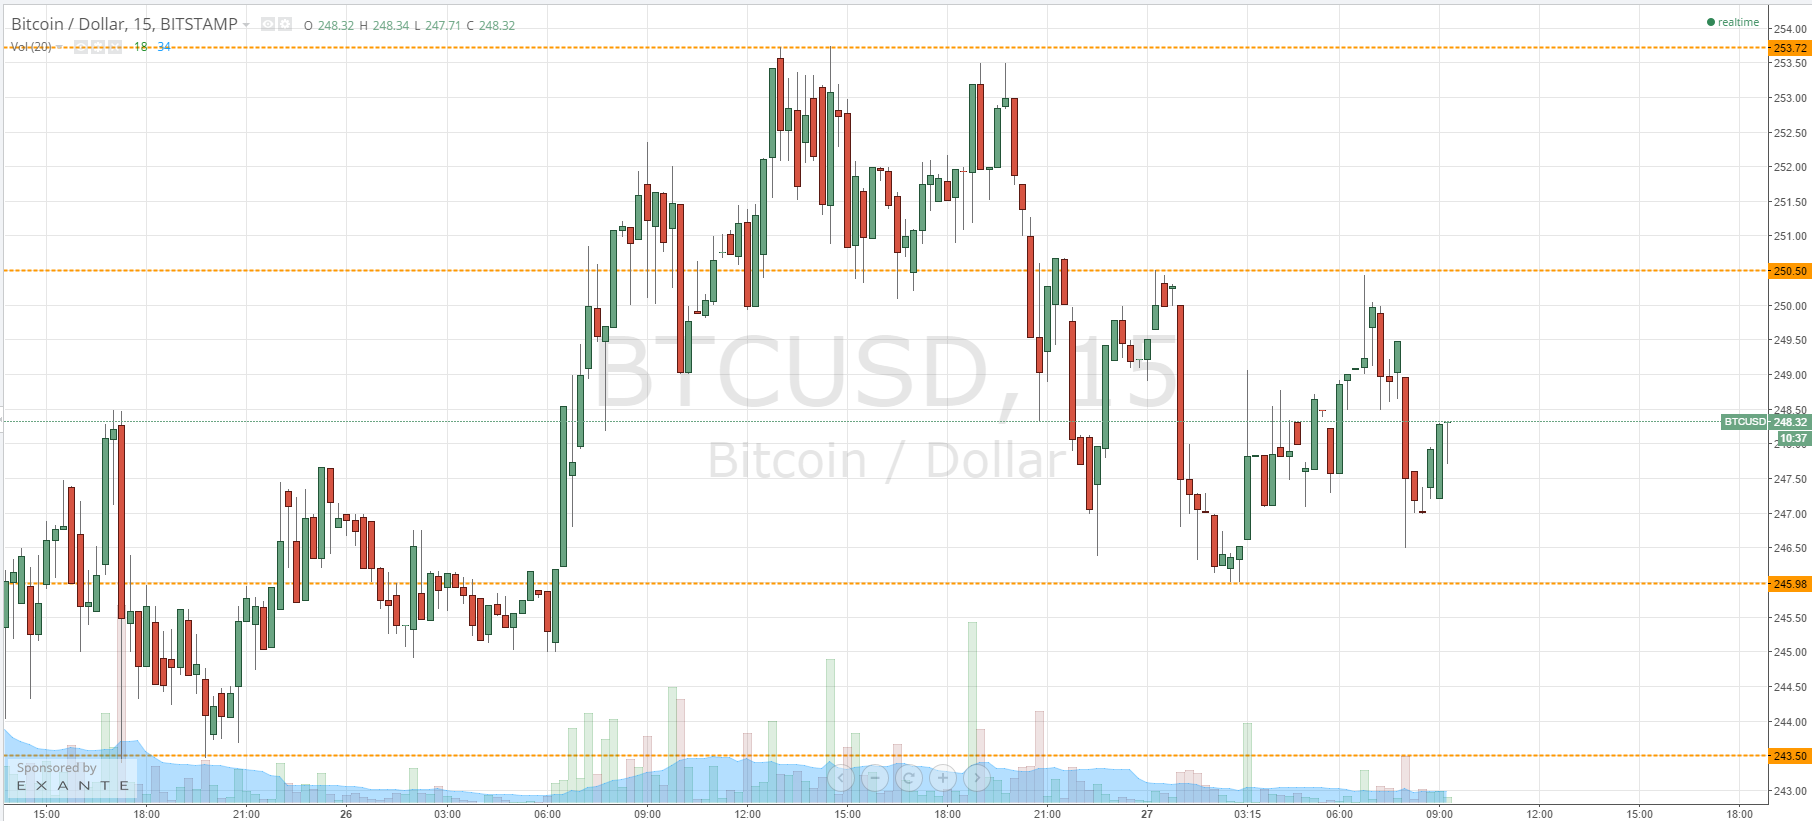
As the chart shows, we saw something of a decline overnight, with the BTCUSD breaking 250 flat to trade all the way down to 245.98 before correcting back up to the aforementioned broken level. We now trade free much evenly between these levels, and they serve as in term resistance and support respectively. Just as with yesterday’s session, it is this support and resistance that we will be watching throughout the rest of the day.
There is every chance that we may just range between these two levels – at least as far as the European session is concerned. Such action would give as an opportunity to enter short on a test of resistance with a target of support, and vice versa. However, if we get a convincing close above resistance, it will signal long entry with an initial target of 253.72. In such a scenario, a stop loss just below this level (somewhere around 249.5) would give us an opportunity for an early exit in the event of a reversal. Conversely, a convincing break below 245.98 would signal a short entry with a target around 243.50, and once again a stop just behind our entry (in this instance, somewhere around 247 flat) would give us a nice risk profile.
Charts courtesy of Trading View