We are heading into the middle of the week and it is time to take the first of our twice-daily looks at the bitcoin price in an attempt to cobble together a strategy that we can use to try and draw a profit from the market if and when we see any volatility going forward.
Normally, we take a look at what happened overnight so as to garner a bit of insight into how price brought us to where things stand. Right now, however, things are moving pretty fast, so we aren’t going to waste any time going over previous action. Instead, because we don’t want to miss a trade, we are going to jump right into our analysis and get some key levels in place straight away.
So, with this noted, let’s kick things off for the session today. As ever, take a quick look at the chart below before we get started so as to get an idea where things stand. It is a one-minute candlestick chart and it has our range overlaid in green.
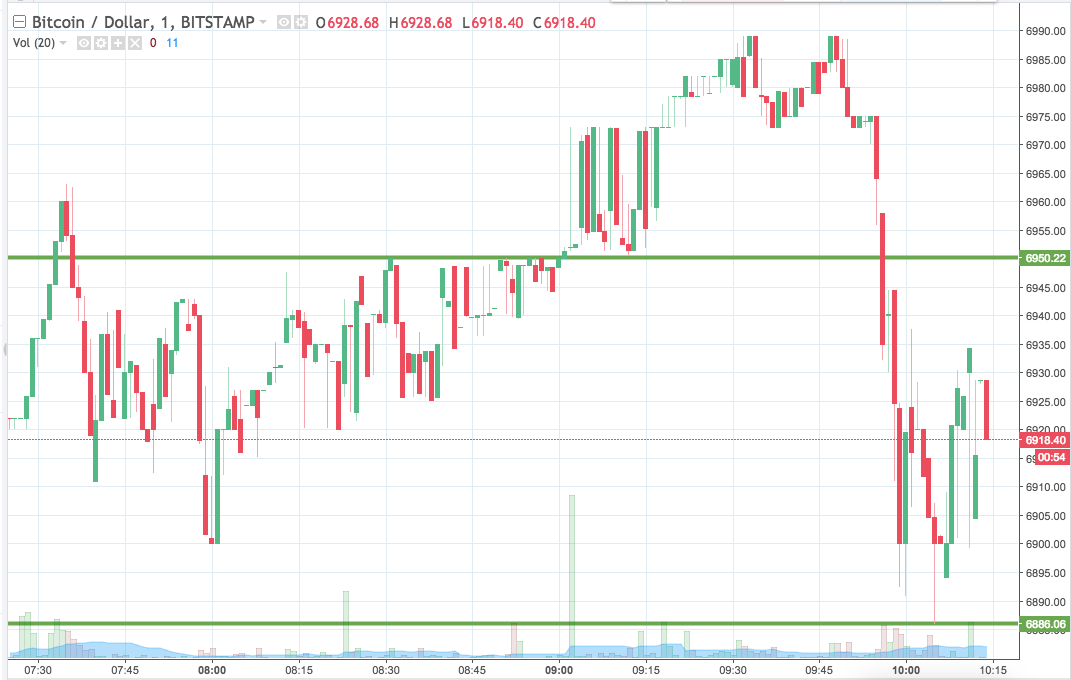

As the chart shows, the range we are looking at for the session today comes in as defined by support to the downside at 6886 and resistance to the upside at 6950.
We are going to stick with our breakout strategy, so we will put our intrarange approach on the back burner for the time being.
Looking to the upside and to our first potential entry, we will jump in long towards an immediate upside target of 7000 flat if we see a break above resistance. A stop loss on the trade at 6935 looks good from a risk management perspective.
Looking south, if we get a close below support, we will jump in short towards a downside target of 6830. Again we need a stop loss on this one and somewhere in the region of 6900 looks like it should do the job.
Let’s see how things play out.
Charts courtesy of Trading View