Well, it’s looking more and more likely we’re going to get the magic 800 flat level this afternoon. Things have been heating up in the space over the last twenty-four hours or so, and this has brought the bitcoin price to trade just shy of the level we’ve been harping on about for the last couple of months. As we said last night, if we do finally see a run through 800, we expect a considerable run of sustained momentum to follow. Exactly how far this run will travel is not totally clear – sometimes it’s ten or so points, sometimes more. We’ll be targeting at least ten, so as a brief side note to today’s analysis, that’s something to keep in mind. Specifically, regardless of our ongoing operations, if price breaks 800, we’ll be getting in long towards 810, with a stop at 796. One of the very rare occasions on which we will break our one trade at a time rule.
Anyway, getting back to the present, let’s outline today’s range in an attempt to put together some key levels and – in turn – draw a profit from action at the close of the week. As ever, take a quick look at the chart below to get an idea of where things stand, and what’s happened overnight.
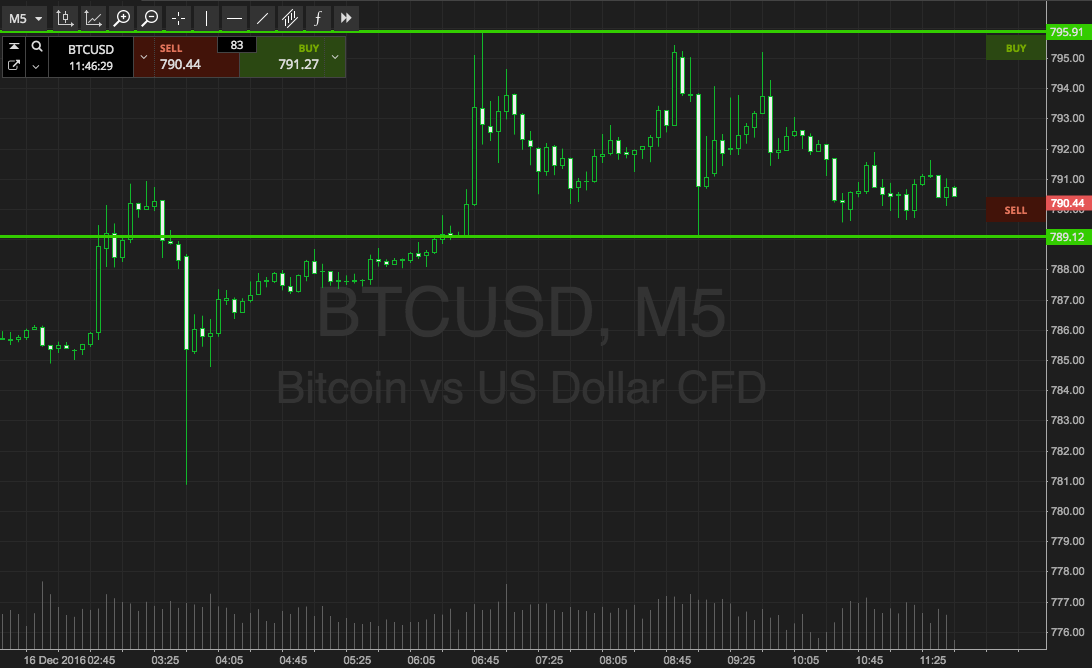

As the chart shows, the levels we are focusing on for this morning are support to the downside at 789 and resistance to the upside at 796. This is a pretty narrow range, so we won’t be attempting any intrarange entries for this morning’s session at least.
If price breaks above resistance, we will look for a close above resistance to validate an immediate upside entry towards 805. A stop loss on this position somewhere in the region of 793 works to define risk on the trade. Conversely, if price breaks below support, a close below will signal short towards 782. Again we need a stop loss, and somewhere around 792 looks good.
Happy Trading!
Charts courtesy of SimpleFX