The week is now well and truly underway and it’s time to take a look at how things are moving in the bitcoin price and where we expect things to go from here near term. Overnight action brought pretty much a continuation of the sort of stuff we were seeing during the session on Monday, with a bout of upside momentum followed by some short-term corrective activity and, subsequently, a return to the overarching upside trend subsequent to the correction completing.
When price is running as part of an overarching uptrend, the importance of this sort of action can’t really be understated. It’s representative of markets repeatedly rebalancing so as to shake out the shorter-term operators and to ensure that the trend remains in place.
With this in mind, it’s safe to say that, so long as we see a continuation of this same sort of action during the session today, we are looking at some strength heading into the middle of the week.
So, with all that said, let’s get some levels in place we can use right now.
As ever, take a quick look at the chart below before we get started so as to get an idea where things stand. It is a one-minute candlestick chart and it has our range overlaid in green.
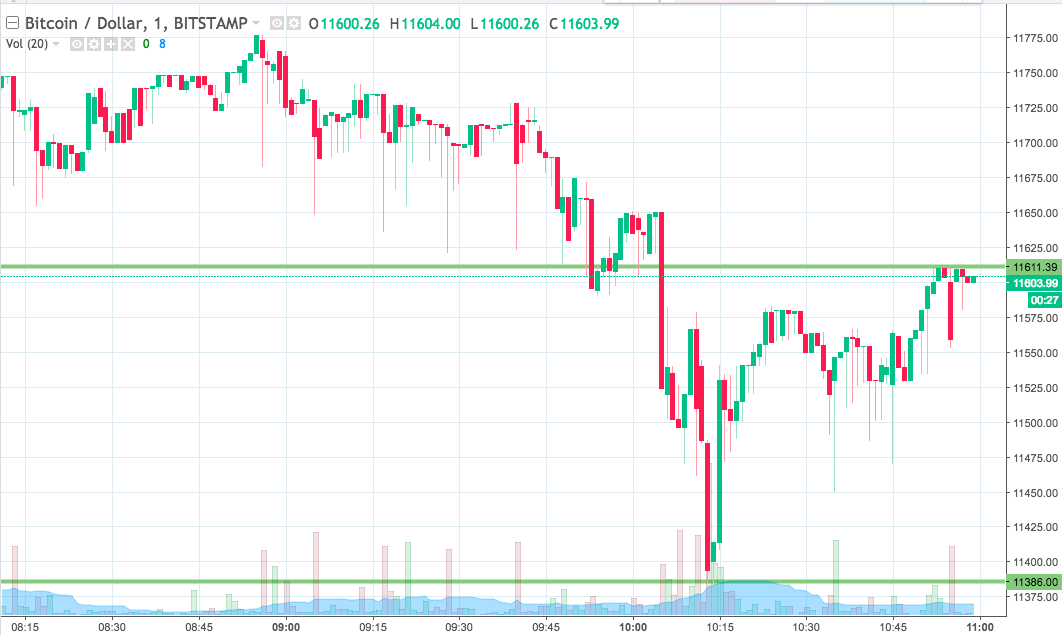

As the chart shows, the range we’re looking at for the session today comes in as defined by support to the downside at 11386 and resistant to the upside at 11611.
Standard breakout rules apply for the session, so we will look to enter long towards an immediate upside target of 11680 on a close above resistance and, conversely, a short entry towards a downside target of 11300 on a close below support.
Stop losses on both positions somewhere in the region of $10 or $20 above or below the key entry levels will ensure we are taken out the trades if things turn against us.
Let’s see what happens.
Charts courtesy of Trading View