For those with any degree of long-term holdings in the bitcoin space right now, things aren’t looking great. This time last week, the bitcoin price was trading around the $1200 mark. Fast-forward 6 or 7 days, and we are now down to sub $800 – a more than 35% decline across the period. From an intraday perspective, this hasn’t necessarily been a negative. We have had many opportunities to get in and out of the markets according to our intraday strategy, and take advantage of the volatility that we’ve seen over the last few days to draw a profit from the market. In some ways, our intraday strategy has served as a pretty solid hedge against the overarching downside momentum in the bitcoin price right now. Of course, we have long-term holdings as well, and we would rather not see bitcoin decline in this fashion. However, with the gains seen a couple of weeks ago, that we were due a correction was almost an inevitability. Anyway, let’s have a look at today’s action, and see if we can outline some levels for the evening session.
Take a look at the chart below before we get started. 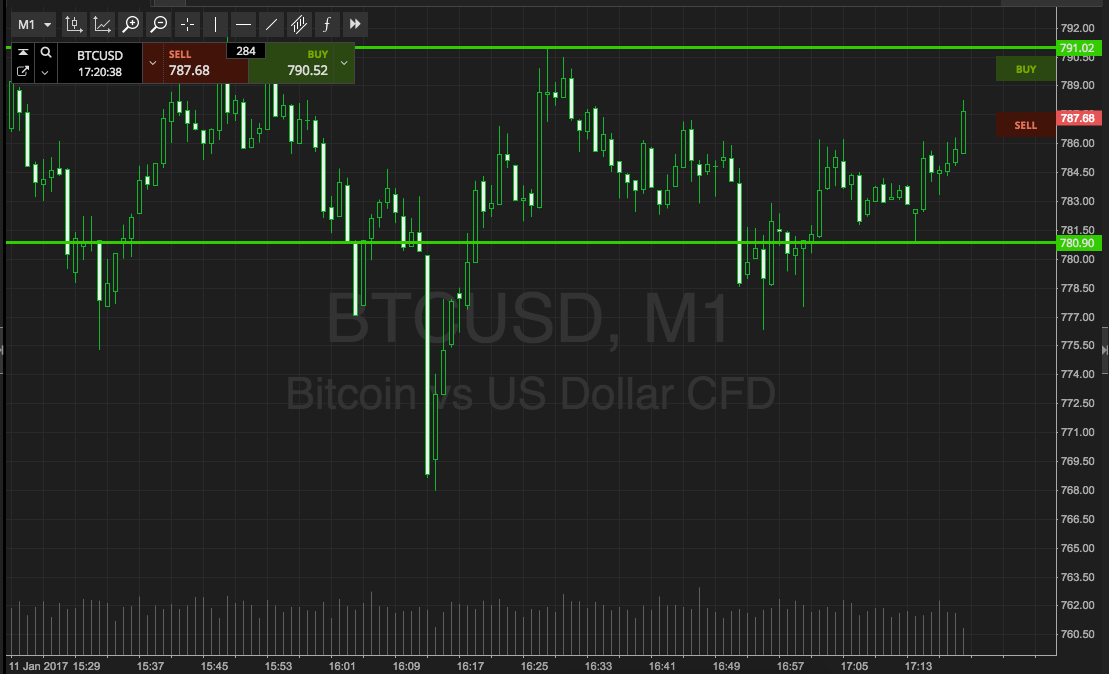

As the chart shows, the range for today’s session is defined in term support to the downside at 780, and resistance to the upside at 791. Breakout only this evening. If we see price break above resistance, we will look to enter a long position towards an immediate upside target of 800. A stop loss on the position at 787 works to define risk. Conversely, a close below support will put us in short towards 770. Again we need a stop loss, and somewhere in the region of 783 looks good. These stop loss entries will ensure that we are taken out in the event of a price reversal, and make sure we only have to sustain a small and manageable loss.
Charts courtesy of SimpleFX