So that’s another day of trading complete in our bitcoin price trading efforts and – in line with the completion of the day – it’s also the end of the week.
And what a week it has been.
Price started the week in what looked like it might be a pretty substantial and then, relatively quickly, recovered the losses it had recorded. Throughout the majority of the middle of the week, price consolidated with a slight weight towards the upside and, as we outline this morning, it looked as though things were only open again. However, late this afternoon, price has just taken a dive and we are now pretty much in around when we started the week.
This isn’t a terrible thing, but it is a bit of a blow heading into the weekend. If we can negate the downside action with an intraday hedge, however, things will be made a lot easier. So, with that in mind, let’s get some levels in place that we can use for the session this evening. Take a quick look at the chart below before we get started. It is a one-minute candlestick chart and it has our range overlaid in red.
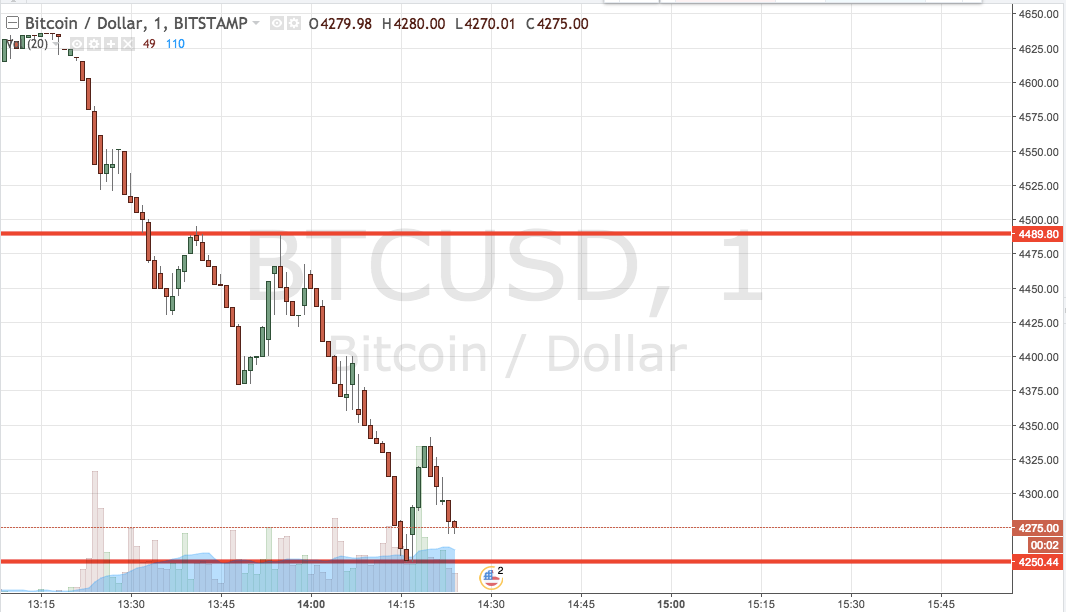

As the chart shows, the range we are using for the session this evening comes in as defined by support to the downside at 4250 and resistance to the upside at 4489. This is a far wider range with them we would normally use, so we are going to mix things up a little bit. Specifically, if we see a close below support, we will enter short towards 4200. Conversely, if we see a bounce from current levels, we will enter long towards an upside target of 4489 (resistance. On the first trade, a stop at 4260 looks good. On the second trade, a stop at 4220 does the job.
Charts courtesy of Trading View