The end of the day has come in Europe, and it’s time for us to take the second of our twice daily looks at the bitcoin price. We mentioned this morning that action this week so far has been somewhat lackluster, and that we’ve not had too many opportunities to get in and out according to our standard intraday strategy. We’ve had a few, but some have turned out to be a bit choppy and resulted in a stop loss takeout.
In an attempt to liven things up a little bit today, we narrowed our range and went for some scalp breakout trades with extra tight targets. We managed to get in and out a couple of times for some small profits, and so tonight we’re going to recreate that strategy.
So, without further ado, and as we head into the Asian session open, let’s take a look at what’s on for the evening. As ever, take a quick look at the chart below to get an idea of what we are focusing on specifically. It’s a five-minute candlestick chart with around twelve hours’ worth of action displayed, and our range in focus overlaid.
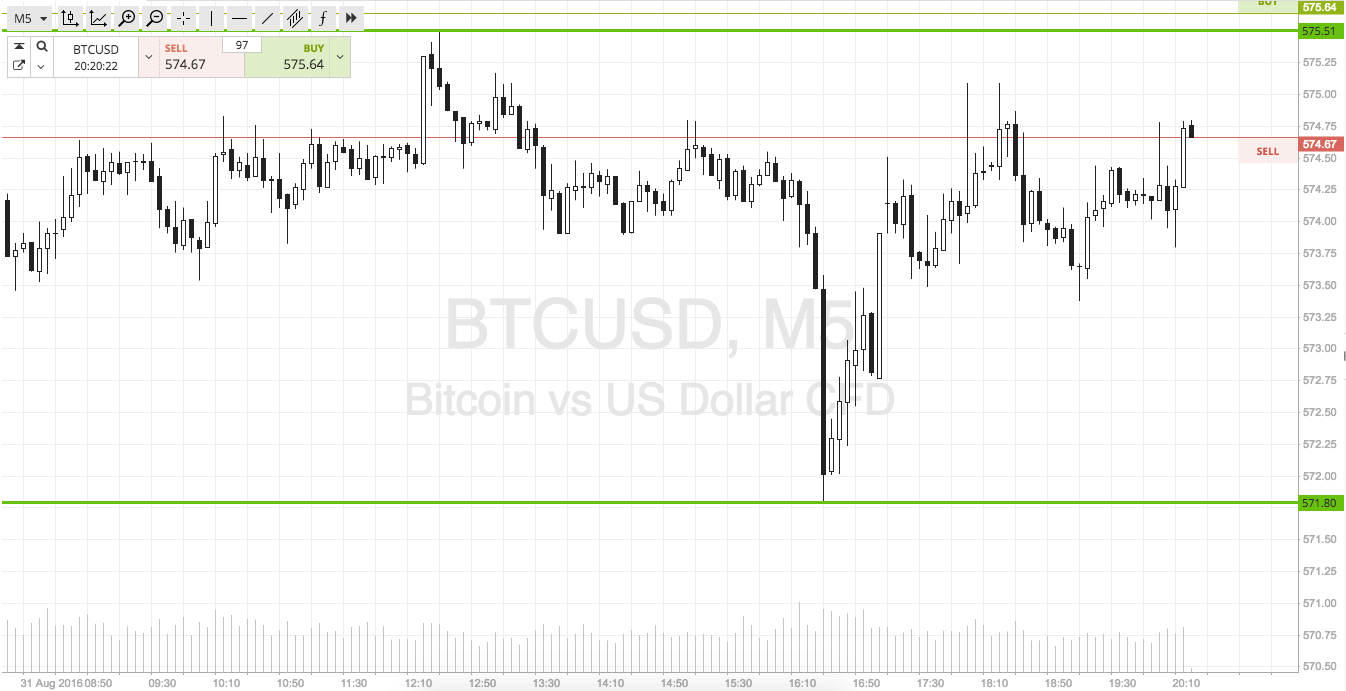

As the chart shows, the range we are looking at is defined by in term support to the downside at 571 flat, and in term resistance to the upside at 575. It’s not wide enough to go at price with an intrarange strategy, so we are going to look at breakout only – at least until tomorrow morning.
If price breaks above resistance, we will look for a close above 575 to validate an upside entry towards 560 flat. A stop loss somewhere in the region of 573 looks good from a risk management perspective.
Looking south, a close below support signals short towards a downside target of 565. Stop at 573 to keep risk tight.
Charts of SimpleFX