OK, things are finally starting to pick up with our bitcoin price trading efforts. Overnight on Monday, we saw some real movement, and price picked up some sustained bullish momentum for what must be the first time in a couple of weeks.
How long it’s going to last remains to be seen. We’ve seen this sort of thing before, and it’s come and gone, corrected and reversed. That said, we’ve been looking for this sort of run for a while now, and it’s here, so we’re not going to write it off.
So, we’re not going to spend too much time on what happened overnight. The chart below highlights the action to this point, and it’s a much better representation of the run than we’ll be able to describe in words.
Take a look at that chart, then, before we get going with the details for today’s session. As ever, it’s got our range overlaid in green, and we’re going with a fifteen minute timeframe this time around – something that we’ve done on a couple of occasions over the last week or so in order to accommodate any sustained volatility we see on the back of today’s markets.
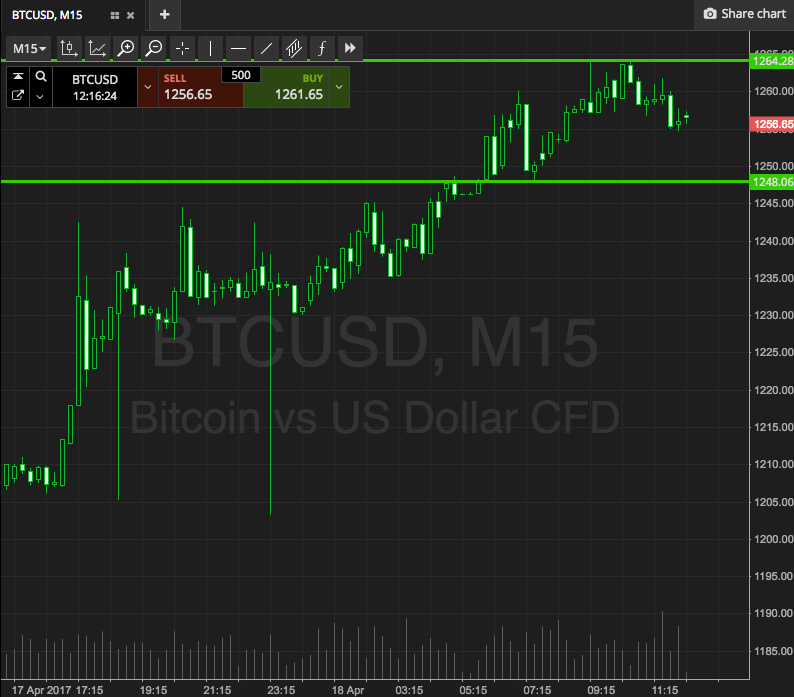

As the chart shows, the range we’ve got in our sights for today’s session is defined by support to the downside at 1248, and resistance to the upside at 1264. There’s probably just about enough room to go at things with an intrarange approach today, but we’re going to stick with breakout. Readers should diverge from this preference at their own discretion.
Looking at breakout, then, if we see a close above resistance, we’ll be looking at getting in long towards an upside target of 1280. A close below support, on the other hand, will get us into a short position towards a downside target of 1235.
Charts courtesy of SimpleFX