Another day done in the bitcoin price, and this one’s been pretty dull. Price action throughout the session hasn’t been particularly inspiring, and not only that, it’s not really told us anything about what we can expect throughout the remainder of the evening. We did manage to get into a quick short position, and this flushed through to completion relatively hassle free, but in terms of sustained momentum, we’re just not getting the volume we need for any maintenance.
No mind.
We can set up against action this evening in the hope that things start to widen out as price matures throughout the US session tonight, and see where things have taken us when we conduct our analysis tomorrow morning.
So, with all that noted, take a quick look at the chart below to get an idea where things stand, and where we are looking to get in and out of the markets according to the rules of intraday strategy this evening out of the US, and beyond in to the Asian session tomorrow morning. It’s a five-minute candlestick chart, and it’s got our key range overlaid in green.
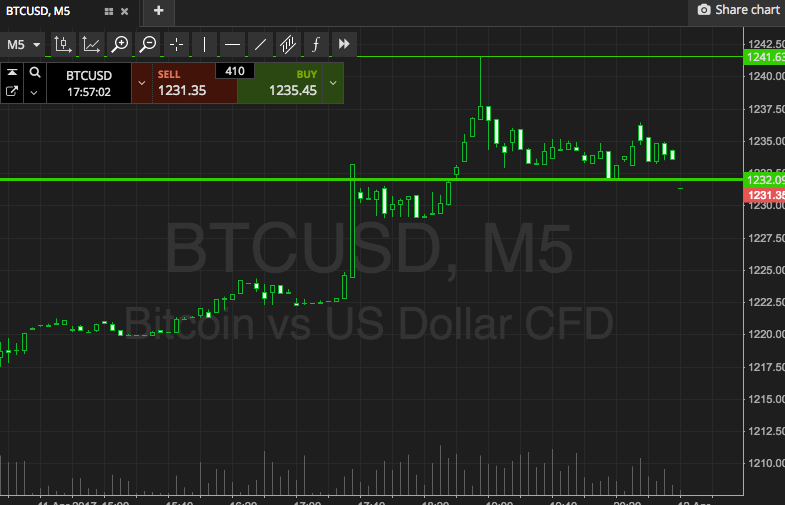

As the chart shows, the range in focus for this evening is defined by support to the downside at 1224 and resistance to the upside at 1242. If we see price break through support, we’re going to look at getting in short towards an immediate downside target of 1213. A stop on this trade somewhere in the region of 1229 will ensure we are taken out of the trade in the event of a bias reversal.
Conversely, a close above resistance will get us in to the markets in the opposite direction. We’ll enter long towards 1255, and place a stop loss at 1237 to take us out if things go wrong.
Let’s see what happens.
Charts courtesy of SimpleFX