So we have come to the end of another week out of Europe for our bitcoin price trading efforts and what a week it has been. What started out as a relatively slow session on Monday pic picked up as we saw the US and European session cross over and things haven’t really slowed down since. Price broke through the $4800 mark today and $5000 flat is getting nearer and nearer. We keep saying it, but at these levels we’ve got to be prepared for a correction. Sure, we aren’t dealing with a traditional financial asset but that makes no difference – we’ve still got an open market price dictated by buyers and sellers. Once price reaches a certain level, people cash out and take profits. Price will decline slightly as this happens and the more risk-averse traders will notice the decline and sell in anticipation of a deeper correction.
It’s inevitable and is going to happen. The question is, how far will price fall and, perhaps more accurately for us believers, how much of a discount will we be able to buy bitcoin for as and when the correction comes into play.
Anyway, that’s the trend side of things. Right now, we are looking at intraday volatility and we are going to tighten things right up for the session this evening. As ever, get a quick look at the chart below before we get started. It is a one-minute candlestick chart and it has our range overlaid in red.
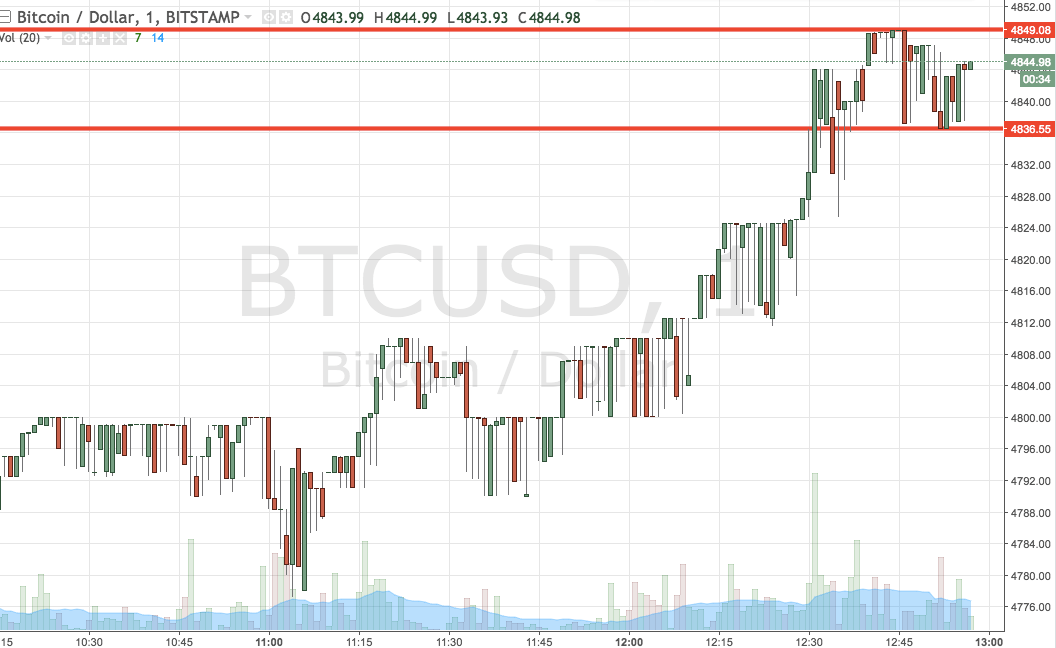

As the chart shows, we are going for a scalp range this evening, as defined by support to the downside at 4836 and resistance to the upside at 4849. If price breaks above resistance, we will enter long towards 4860 with a stop at 4840. Conversely, a close below support will have us in short towards 4800 with a stop at 4845.
Charts courtesy of Trading View