We asked for it last night and we got it this morning. The bitcoin price rose to fresh highs overnight breaking 4700 and putting the bulls very much in control as far as near-term price action is concerned. Subsequent to these highs, however, we did get something of a correction, and price currently sits in and around the 4550 mark. We aren’t going to waste any time getting started today as prices moving so fast that if we do, we may miss an entry so, with this noted, let’s get some levels outlined for the session in an attempt to draw a profit from any volatility as and when it plays out. As ever, take a quick look at the chart below before we get started. It is a one-minute candlestick chart and has our key range overlaid in red.
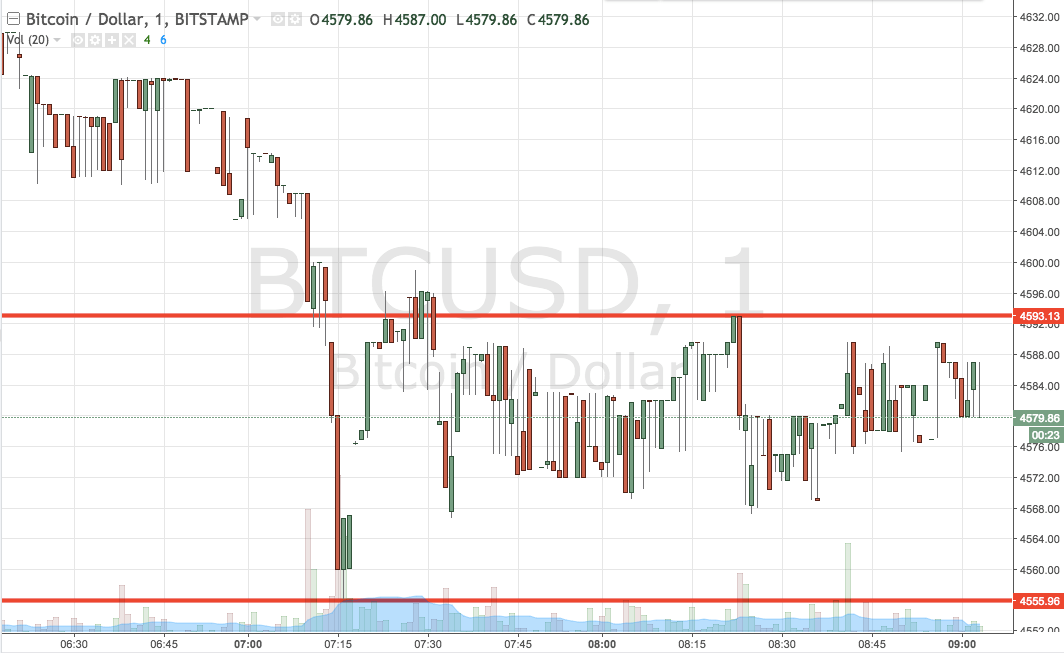

As the chart shows, the range we are using for the session today comes in as defined by support to the downside at 4555 and resistance to the upside at 4593. Standard breakout rules apply for the session, so we will initially look for a close above resistance to validate an immediate upside target of 4620. A stop loss on this one somewhere in the region of 4585 will work to define risk and ensure that we are taken out of the position in the event of a bias reversal.
Looking the other way, if price breaks to the downside, we will be on the lookout for a close below support (at 4555) to signal a downside entry towards a target of 4525. We have a little bit more room on this one from a risk management perspective, so a stop loss somewhere in the region of 4567 gives us enough spectrum to avoid a chop out whilst also ensuring we don’t get caught out on the wrong end of a spike.
Charts courtesy of Trading View