In yesterday evening’s analysis, we noted that we would likely see some degree of correction in the bitcoin price during the late night session out of the US. The driver behind these expectations was that the run we had seen during the day was consolidating and little and that this consolidation pointed towards some near-term weakness.
Turns out we got exactly what we expected – price started to slide shortly after our initial coverage and continued to slip overnight. What we also said, however, is that so long as the 6000 level held firm as support, the bitcoin price should have no problem turning around after its correction to return to the overarching upside directional trend.
As we head into the session this morning, the 6000 level remains solid as support and it looks as though we are seeing price return to the upside near term.
So, with this noted, let’s get some levels in place that we can use to try and draw a profit from the market moving forward. As ever, take a quick look at the chart below to get an idea where things stand and where we are looking to jump in and out of the markets as and when things move. It’s a one-minute candlestick chart and it’s got our key range overlaid in green.
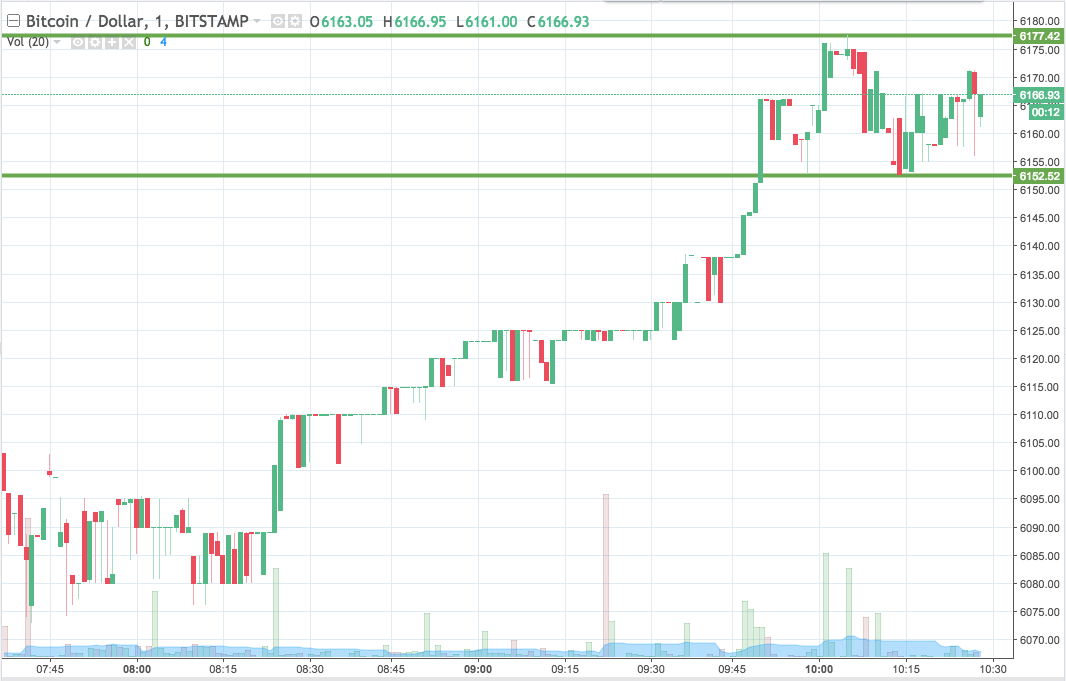

As the chart shows, then, the range we are going to use for the session this morning comes in as defined by support to the downside at 6152 and resistance to the upside at 6177.
If we see price close above resistance, we’ll jump in long towards an immediate upside target of 6200. Conversely, a close below support will have us in short towards a downside target of 6120.
Stops on both trades will ensure we are taken out of the positions if things reverse.
Charts courtesy of Trading View