Well, we have come to the end of the week in the bitcoin price, and it’s time for our penultimate price watch analysis. It’s Friday morning, and a look back at action across the week so far shows a pretty flat few days, with intermittent spikes of volatility, but nothing to write home about. With any luck, as we head into this weekend, there will be some sustained momentum that we can get on the back of and ride out to a profit. This isn’t guaranteed, but those who have followed our analysis across the last few months will know that the weekend often brings some decent volume, and with volume, comes volatility. That’s just around the corner, but we still have two time periods to go before the weekend hits. So, with this in mind, and as we head into the first of these periods (the European morning session) what are we looking to trade in the bitcoin price, and where will we look to get in and out of the markets on any volatility today? As ever, take a look at the chart below to get an idea of the levels in focus, and the range with which we are looking to implement our strategy. It is a 15-minute candlestick chart, which shows the last 24 hours’ worth of action.
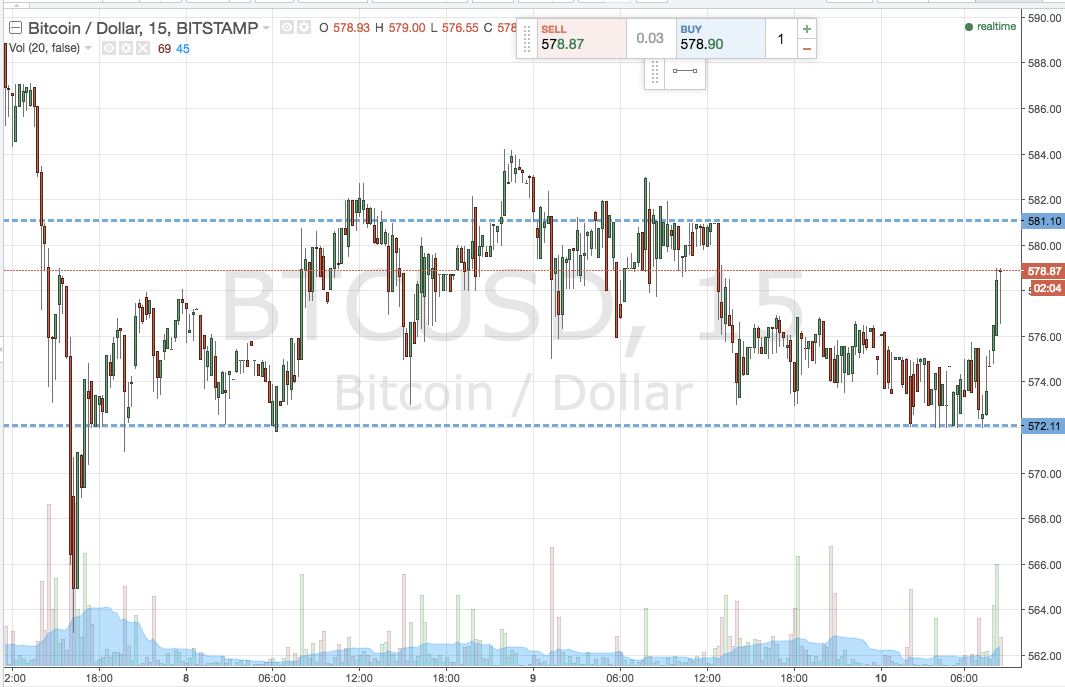

As the chart shows, action overnight bounced from support (having initially broken the level to the downside) and now remains within the range we predefined in yesterday evening’s analysis. We are shifting our perimeter slightly, so support comes in at 572 and resistance at 581.
If price closes above resistance, we will enter long towards an upside target of 587.
If price closes below support, a short entry will signal towards a downside target of 565. A stop loss just the other side of the entry on both positions defines risk nicely.
Charts courtesy of Trading View