We are closing in on the end of another day out of Europe in our bitcoin price trading efforts and the session today has brought with it plenty of action worth discussing. Things really started to move earlier on – immediately subsequent to our publication of the first of our two bitcoin price pieces – and we were able to jump in and out of the markets on a nice upside breakout trade on the volatility. Throughout the afternoon, things settled down a bit, but we are now seeing something of a return to the upside after a brief period of consolidation. The hope is that we will be able to take advantage of this return to the upside and get in on another upside breakout trade.
If it doesn’t happen, however, it’s not too much of a big deal.
We’re still in a position to keep things moving regardless of direction, so let’s get some levels in place that we can use to push forward into the session today. As ever, take a quick look at the chart below before we get started so as to get an idea where things stand. It is a one-minute candlestick chart and it’s got our range overlaid in green.
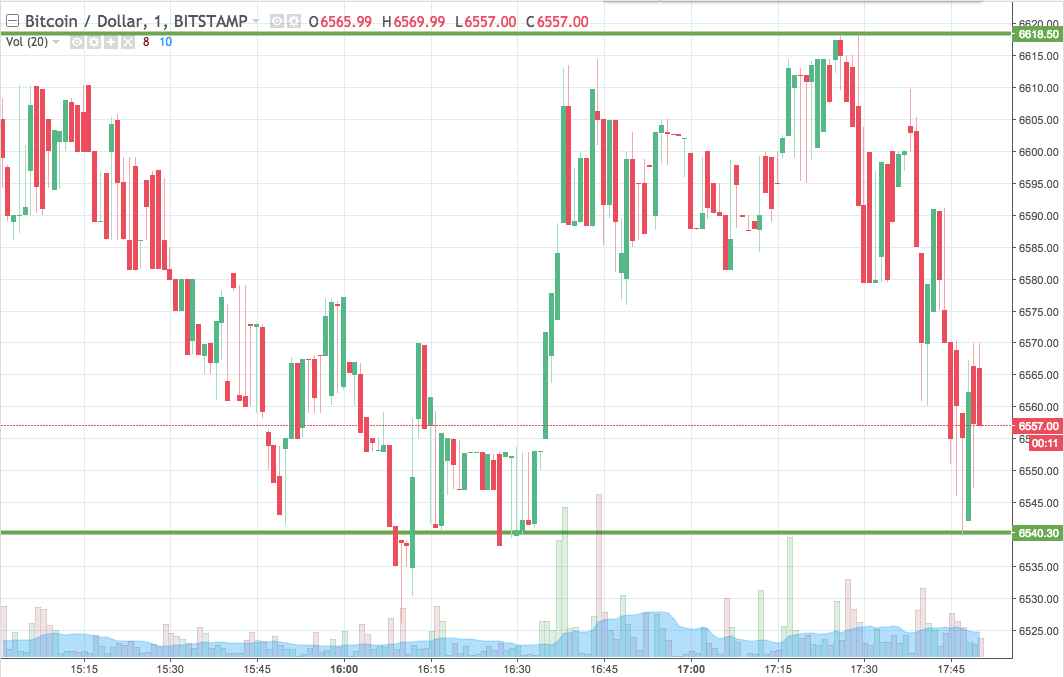

As the chart shows, the range we are looking at for the session today comes in as defined by support to the downside at 6540 and resistance to the upside at 6618. We are going to stick with our standard breakout approach, for the time being, so we will look to jump in long on a close above resistance towards an immediate upside target of 6660. Conversely, if we get a close below support, we’ll jump in short towards a downside target of 6500. Stop losses on both trades just the other side of the entry points on each will ensure that we are taken out of the trades in the event of a bias reversal.
Let’s see what happens.
Charts courtesy of Trading View