We have come to the end of the European session in our bitcoin price trading efforts on Wednesday and it has been a pretty interesting day from a trading perspective. things started moving pretty fast this morning and, subsequent to the volatility, we were hoping that we might see some breakout activity as the day matured towards peak volume. As it turns out, we got exactly what were looking for, with a number of entry opportunities signaled and defined by the levels we put in place as part of this morning’s coverage.
Hopefully, this sort of action will continue moving into the crossover period between the US and European sessions and, beyond, into the Asian session tomorrow morning. If it does, we should be able to maintain our winning streak and jump in and out of the markets according to the rules of our strategy a few more times before the day closes out. In anticipation of this, let’s get some levels in place that we can use to navigate the volatility.
As ever, take a quick look at the chart below before we get started so as to get an idea where things stand and where we are looking to enter in an attempt to take advantage of action. It is a one-minute candlestick chart and it has our range overlaid in green.
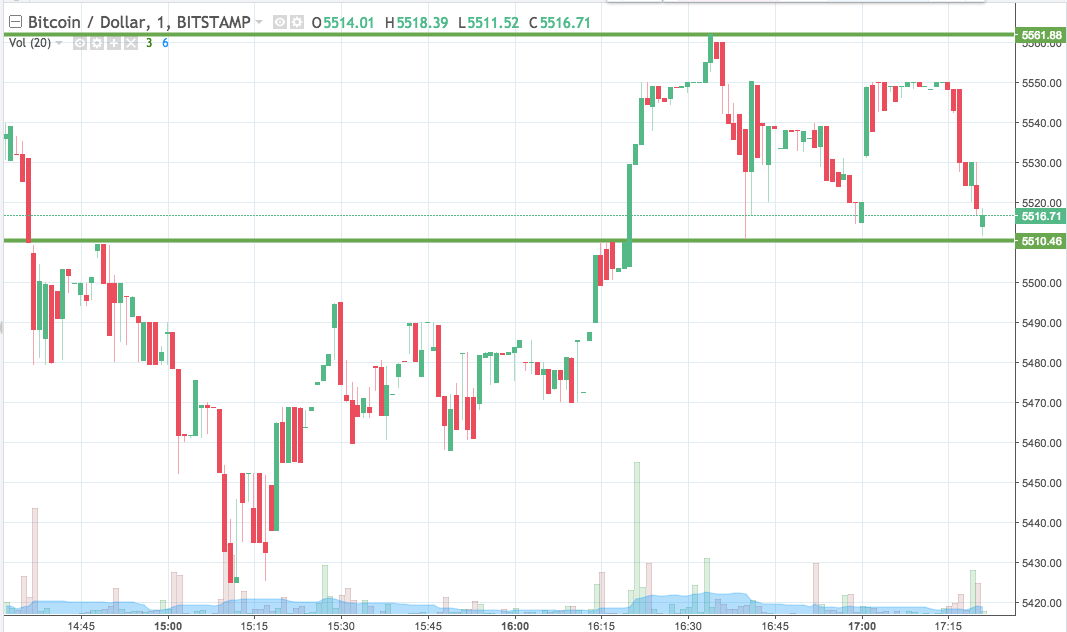

As the chart shows, the range we are looking at comes in as defined by support to the downside at 5510 and resistance to the upside at 5561. Just as we have throughout the day, we are going to limit activity to our breakout strategy for the time being.
So, we will enter longer on a close above resistance towards an immediate upside target of 5595. Conversely, a close below support will have us in short towards a downside target of 5470.
Let’s see how things play out.
Charts courtesy of Trading View